Weather + imagery, one timeline
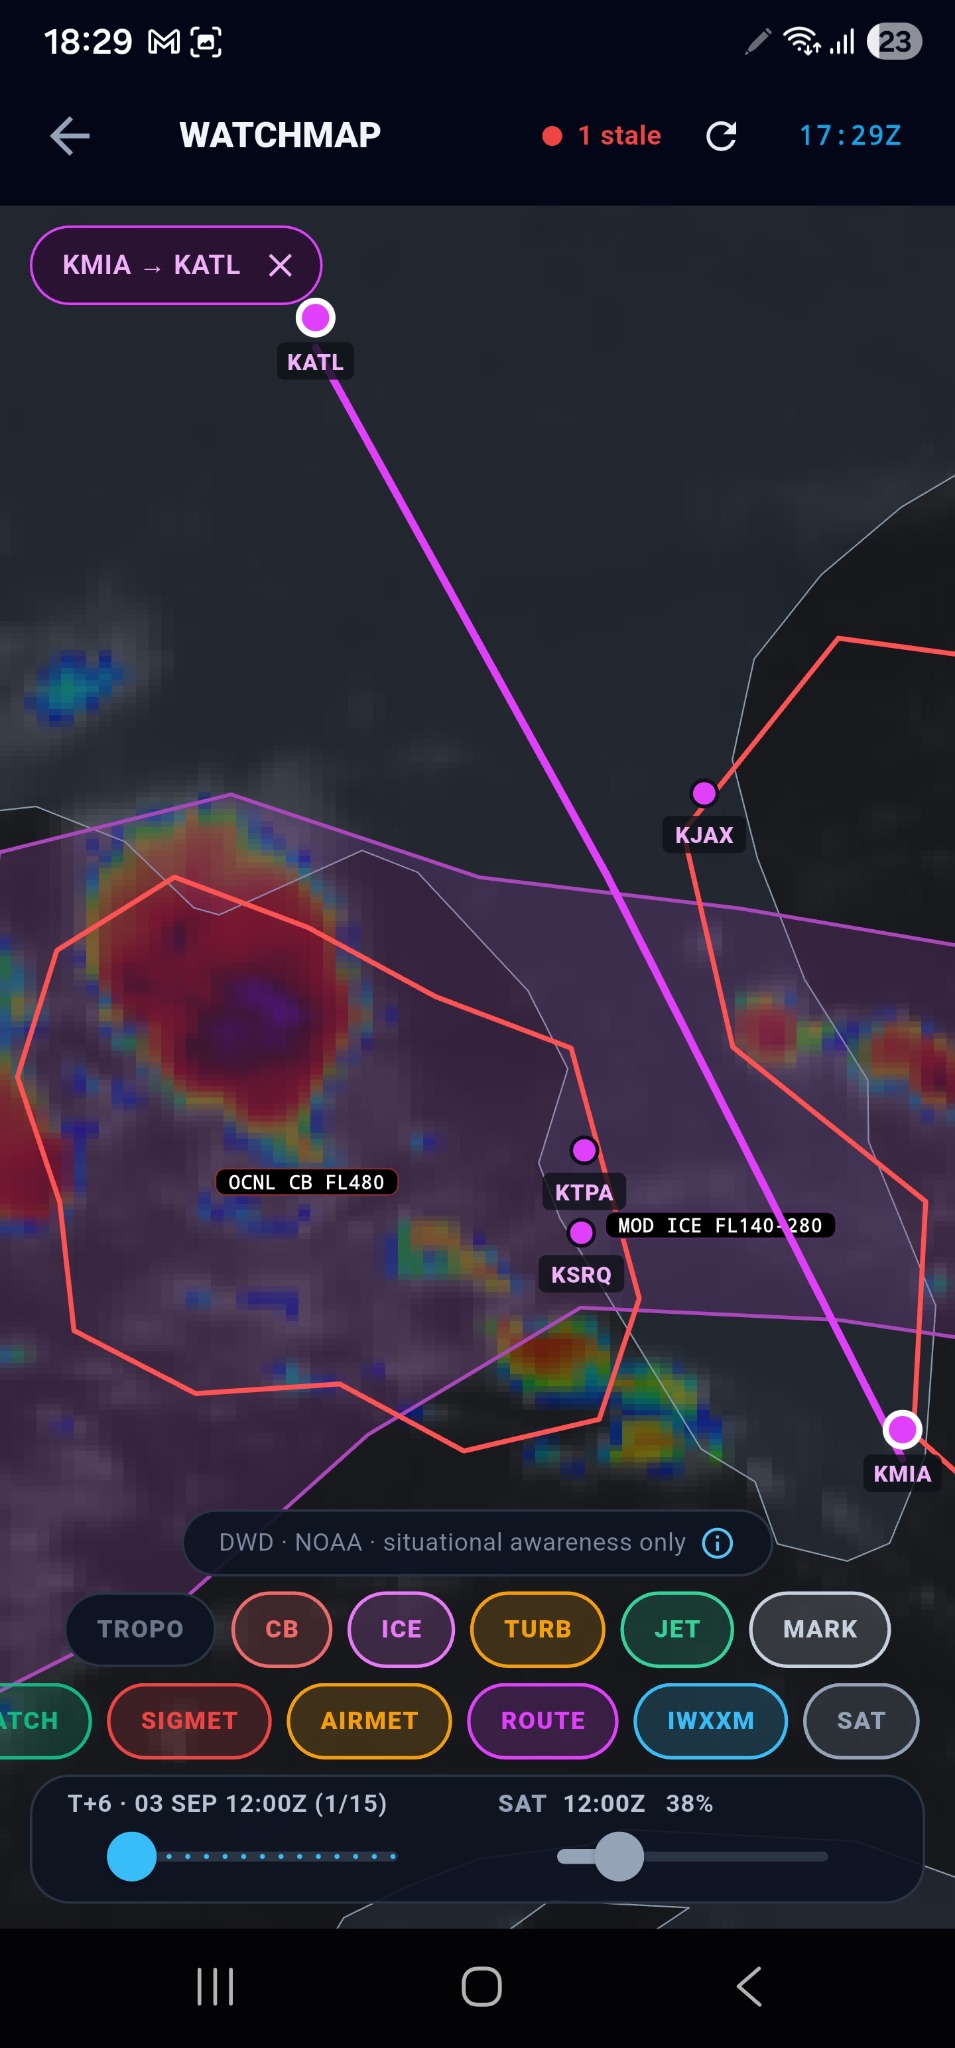
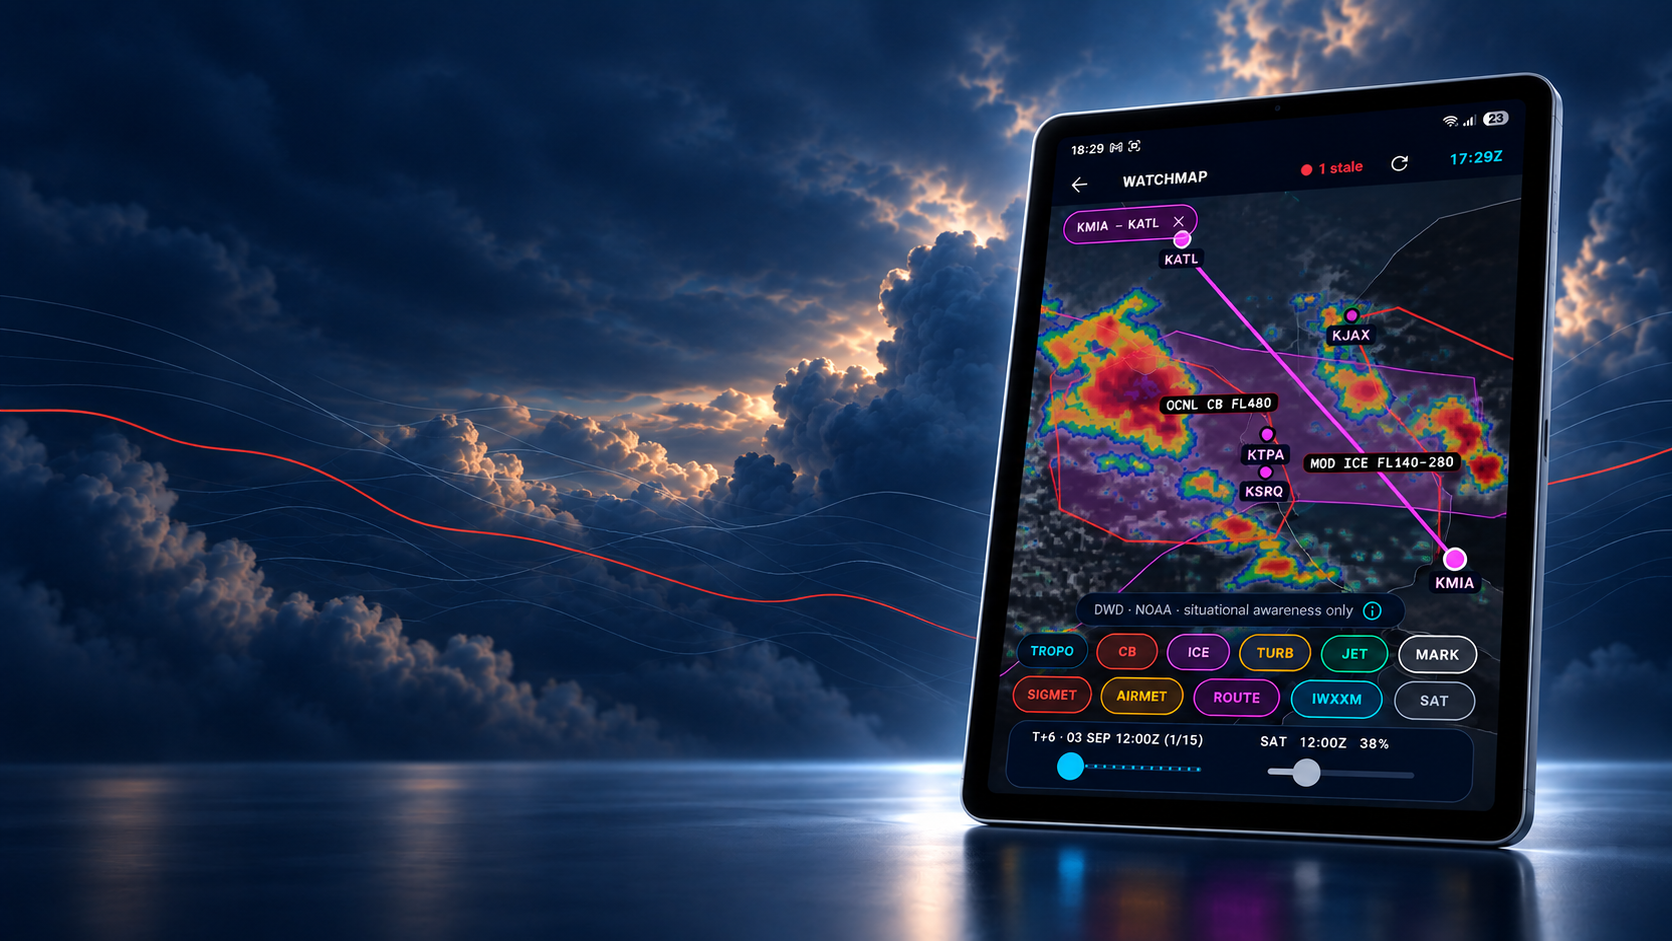
SIGMET polygons over the live DWD satellite layer — scrub hazards and cloud together.
Available now · iOS & Android
The professional pilot’s companion.
Weather, NOTAMs, hazards, route briefing and flight watch — in one fast, cockpit-dark app. Designed by an active airline captain, built on official sources, and engineered to keep working when the signal doesn’t.


Every screen
Weather, notices, hazards, charts, tracking and the calculators — each built for one job, all in one fast, offline-capable app that sits beside your official briefing, never replacing it.
The app
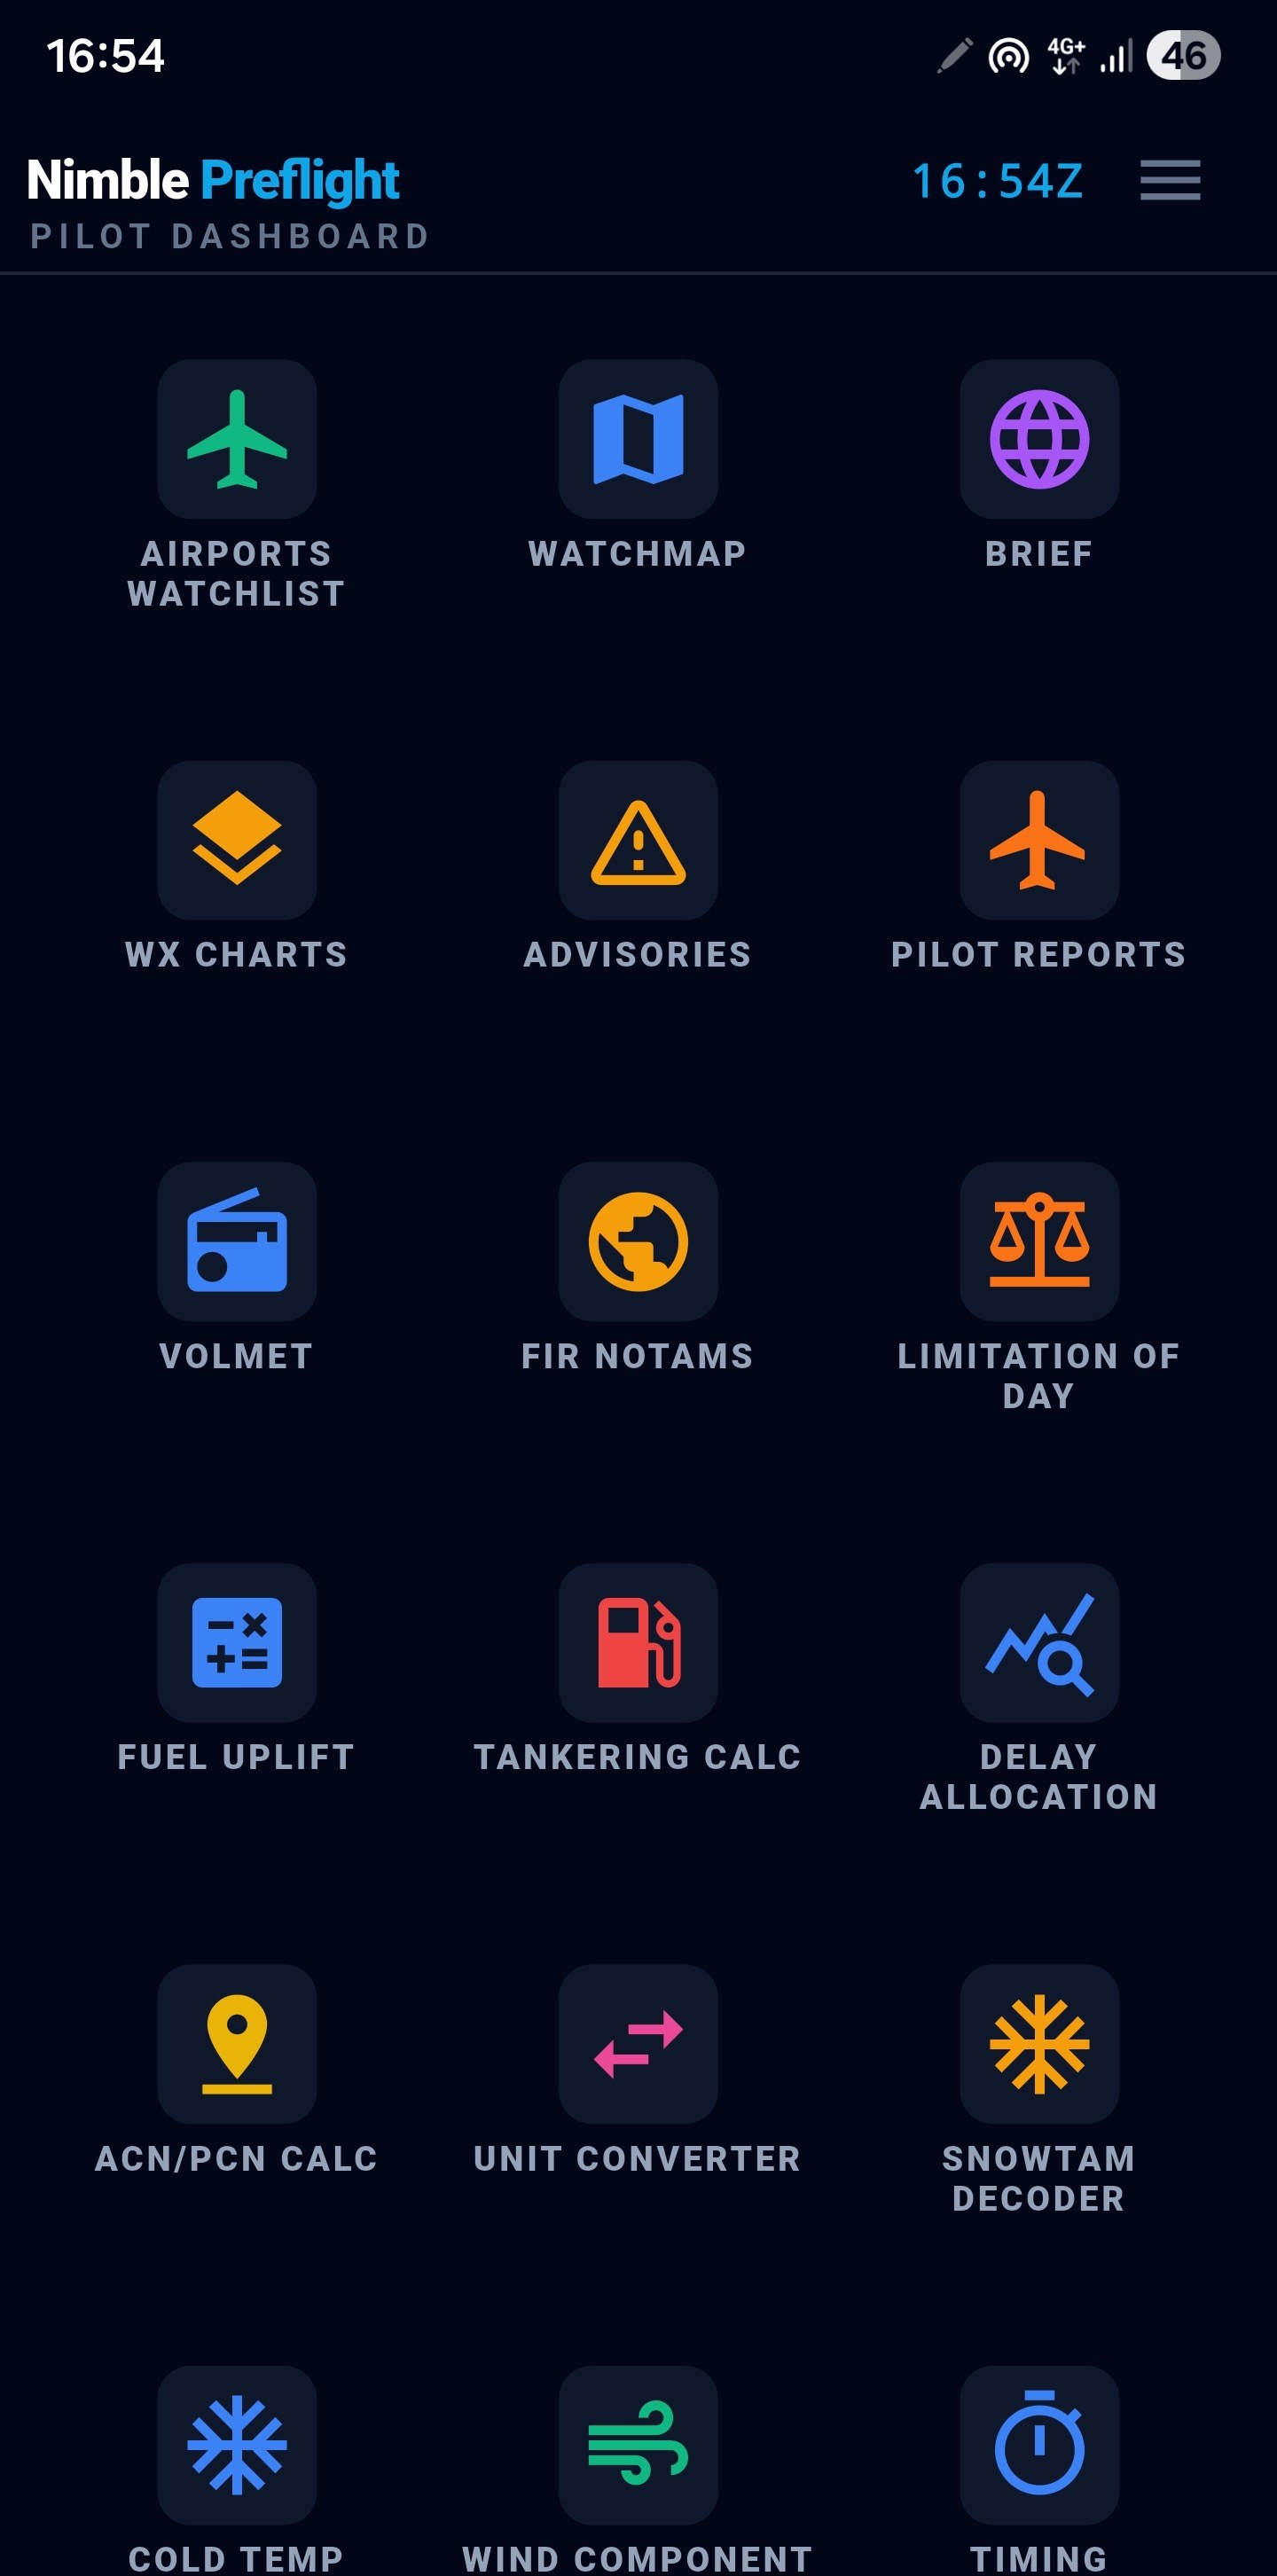
Weather, NOTAMs, advisories, charts, flight tracking and a full set of pilot calculators, gathered into a single fast app. The one you open in the crew room, on the bus, at the gate — everything a tap or two away, and most of it still working when the signal doesn’t.
Watchlist
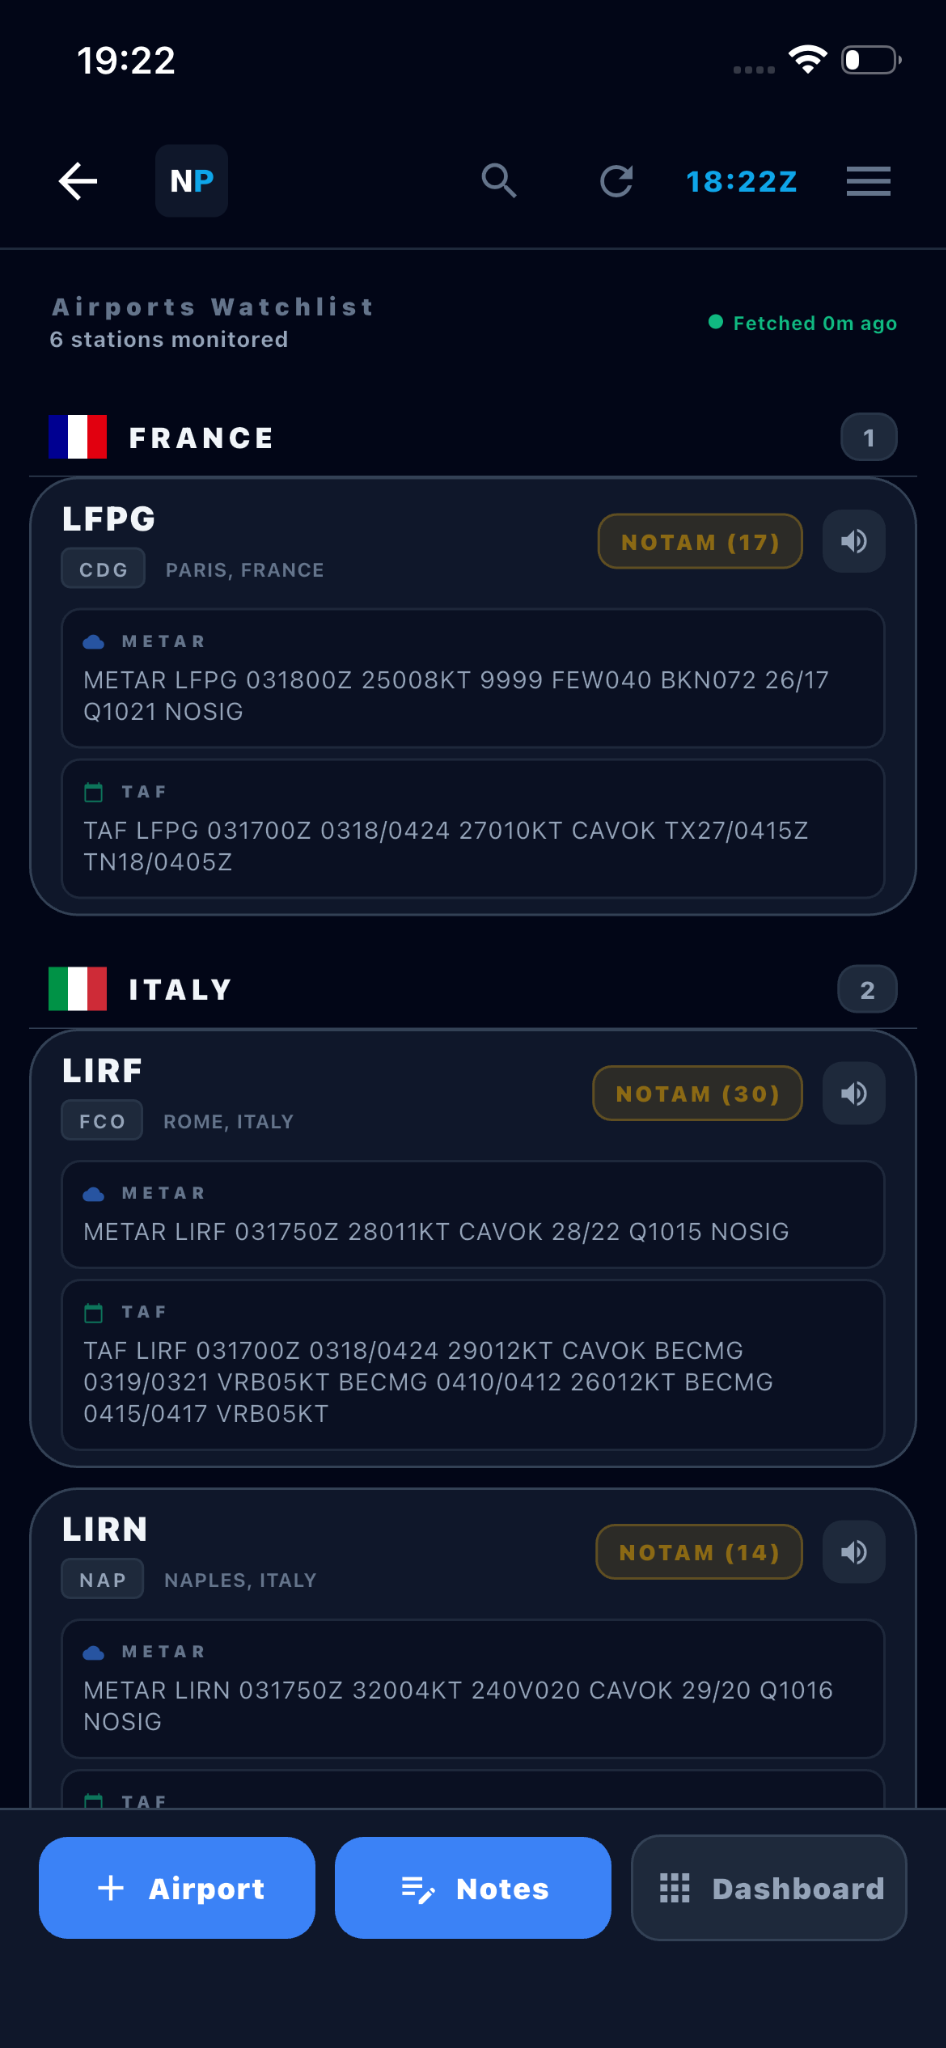
Up to a hundred stations, grouped by country. Each card shows the raw METAR, raw TAF and active NOTAM count without you opening anything — with an honest data-age indicator on top, so you always know how old the picture is.
Live hazard map
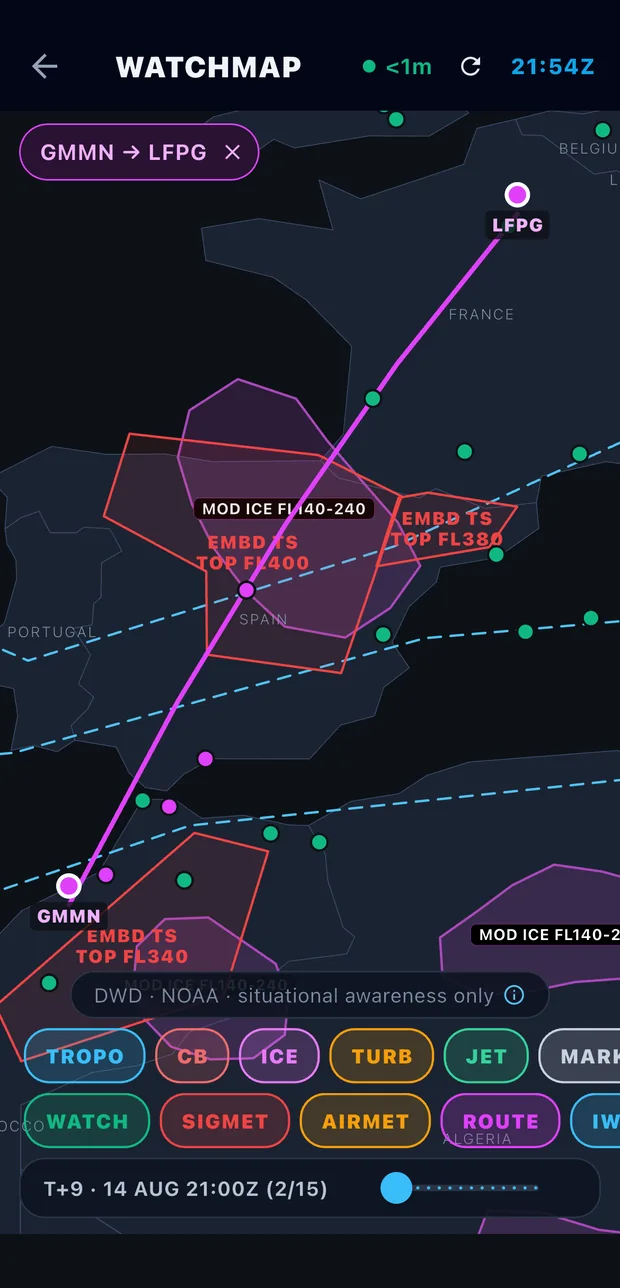
Great-circle track with embedded thunderstorm and icing zones, jet-stream cores and forecast timeline — scrub it to see what’s active at departure, en route, or on arrival.
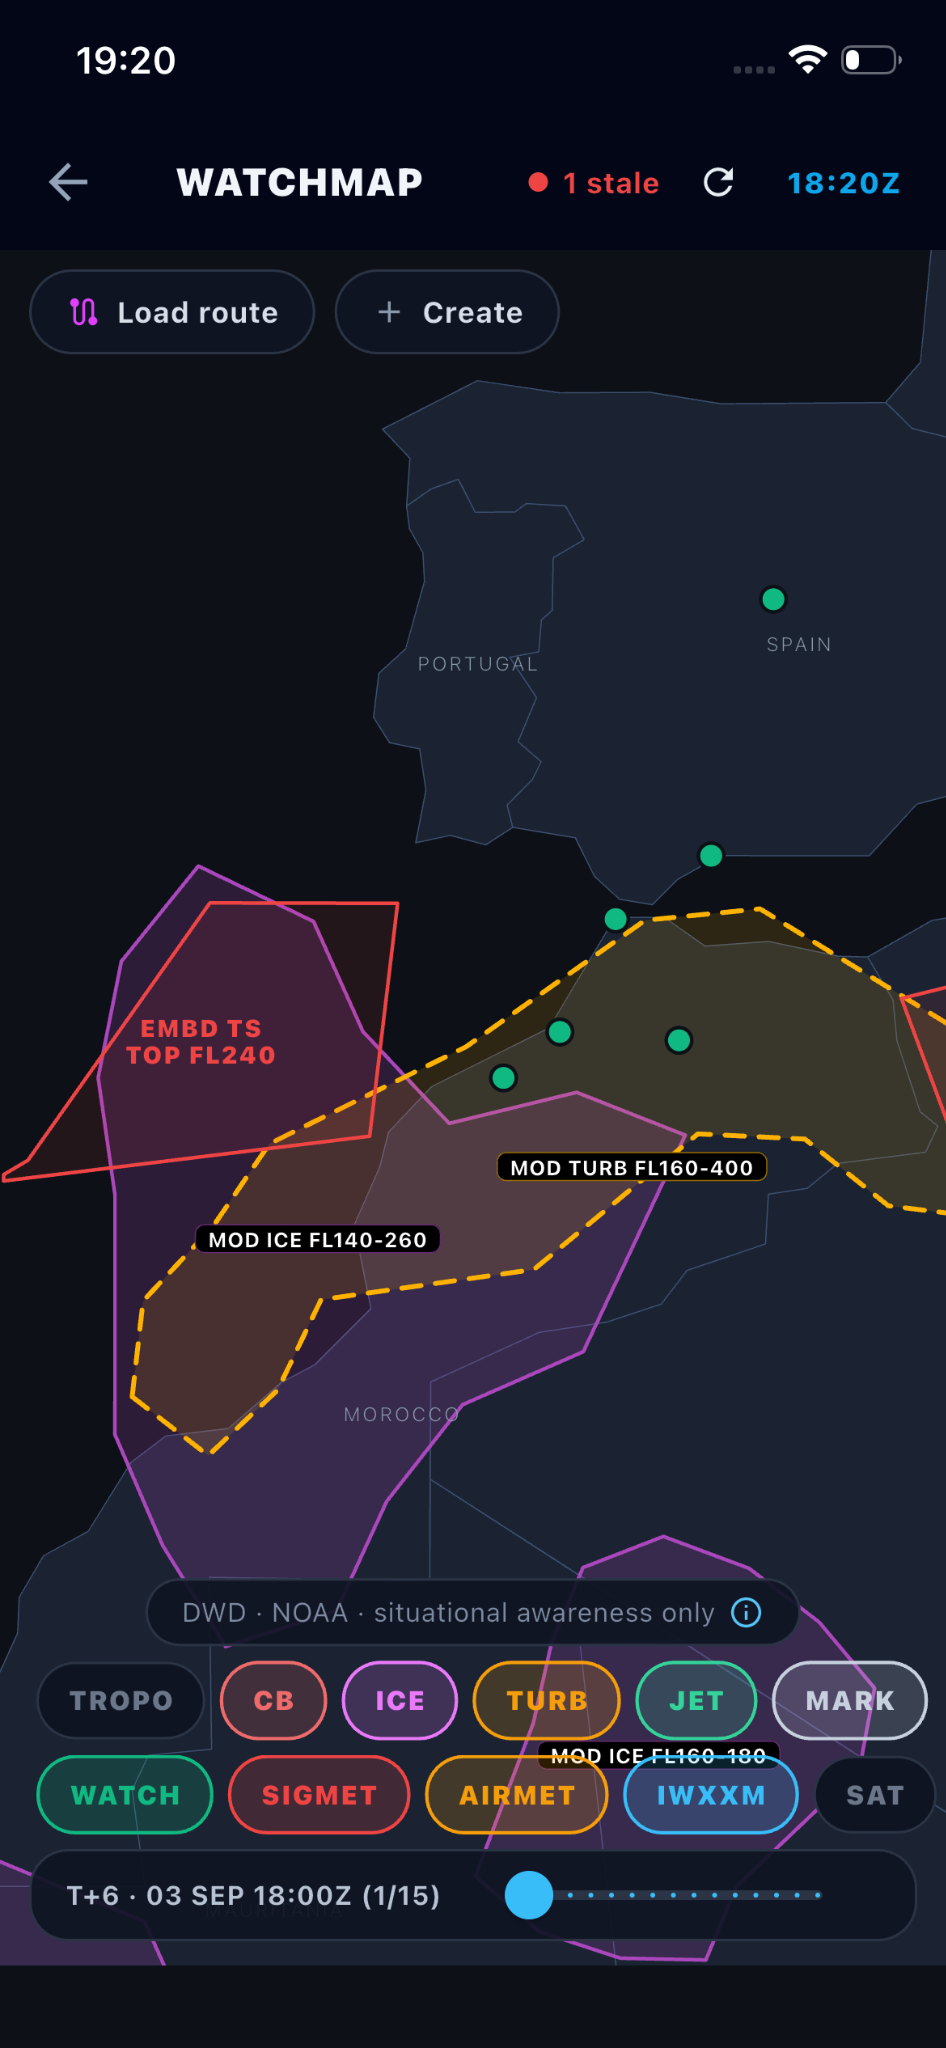
Weather + imagery, one timeline
SIGMET polygons over the live DWD satellite layer — scrub hazards and cloud together.
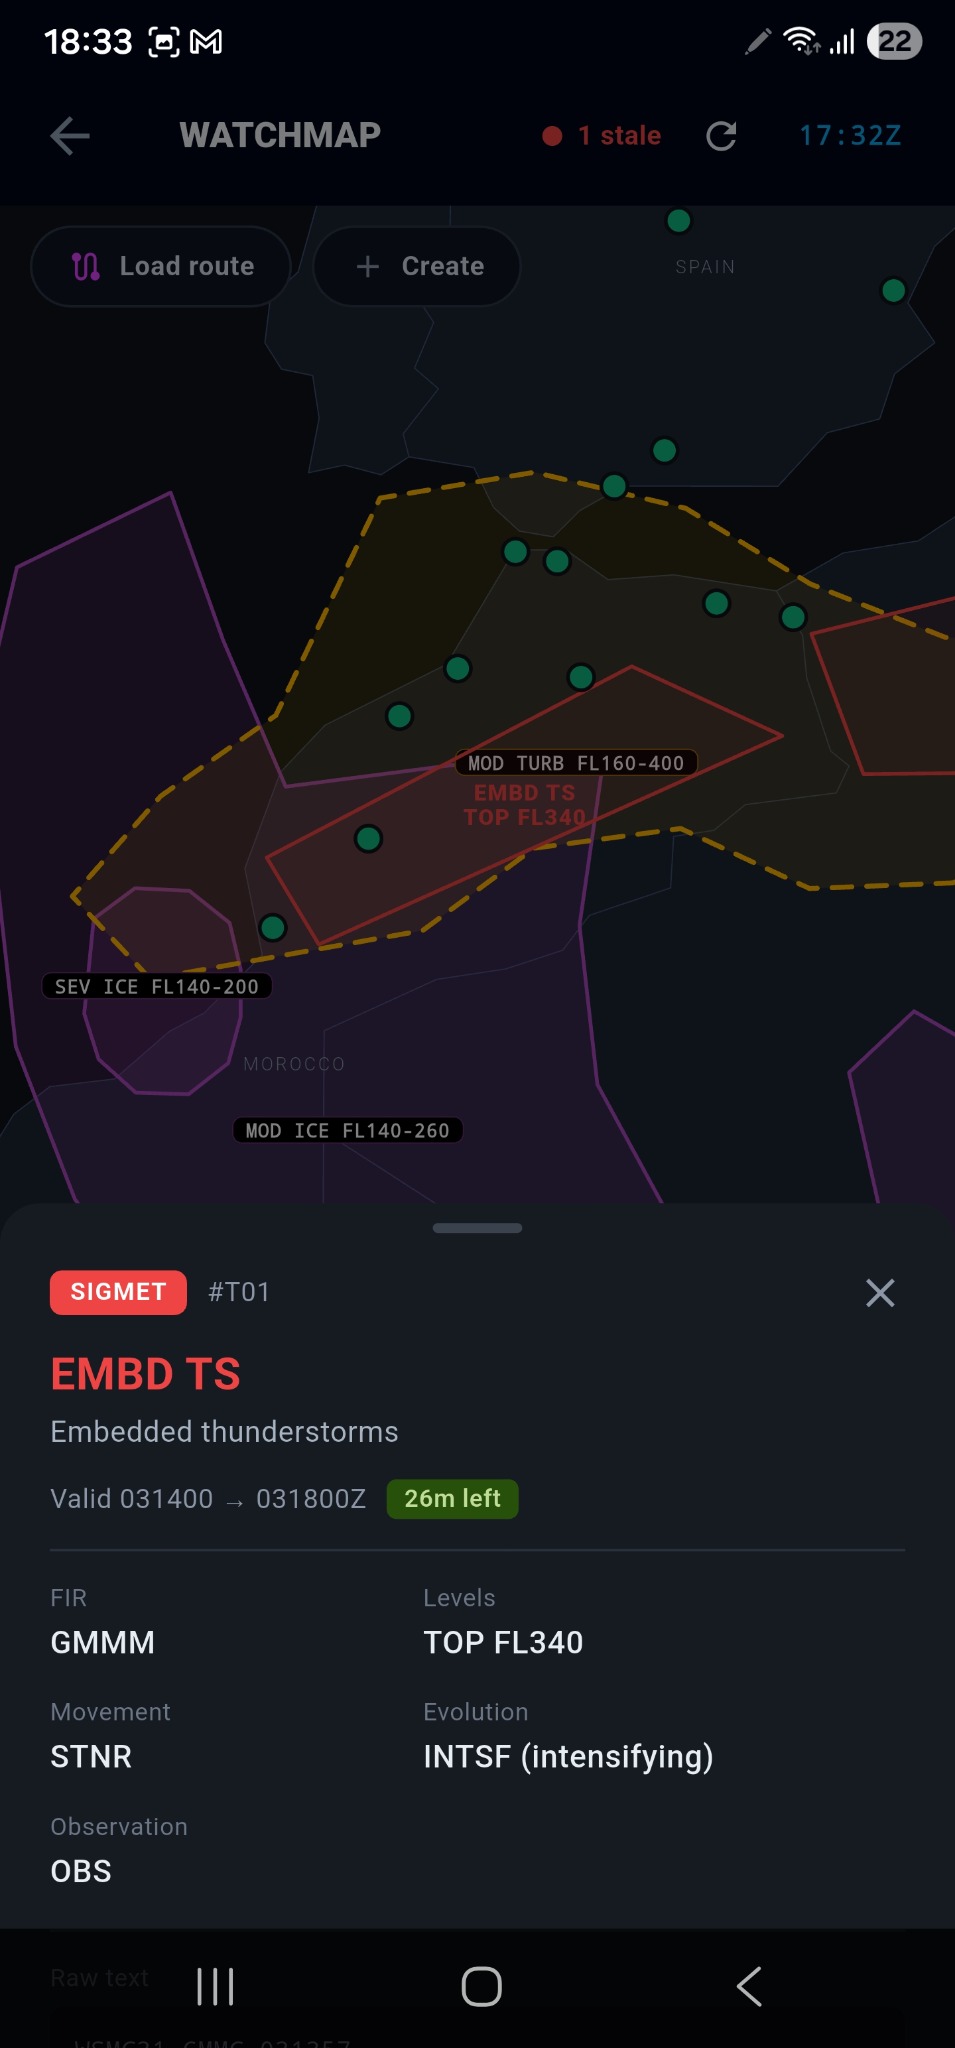
Tap any hazard
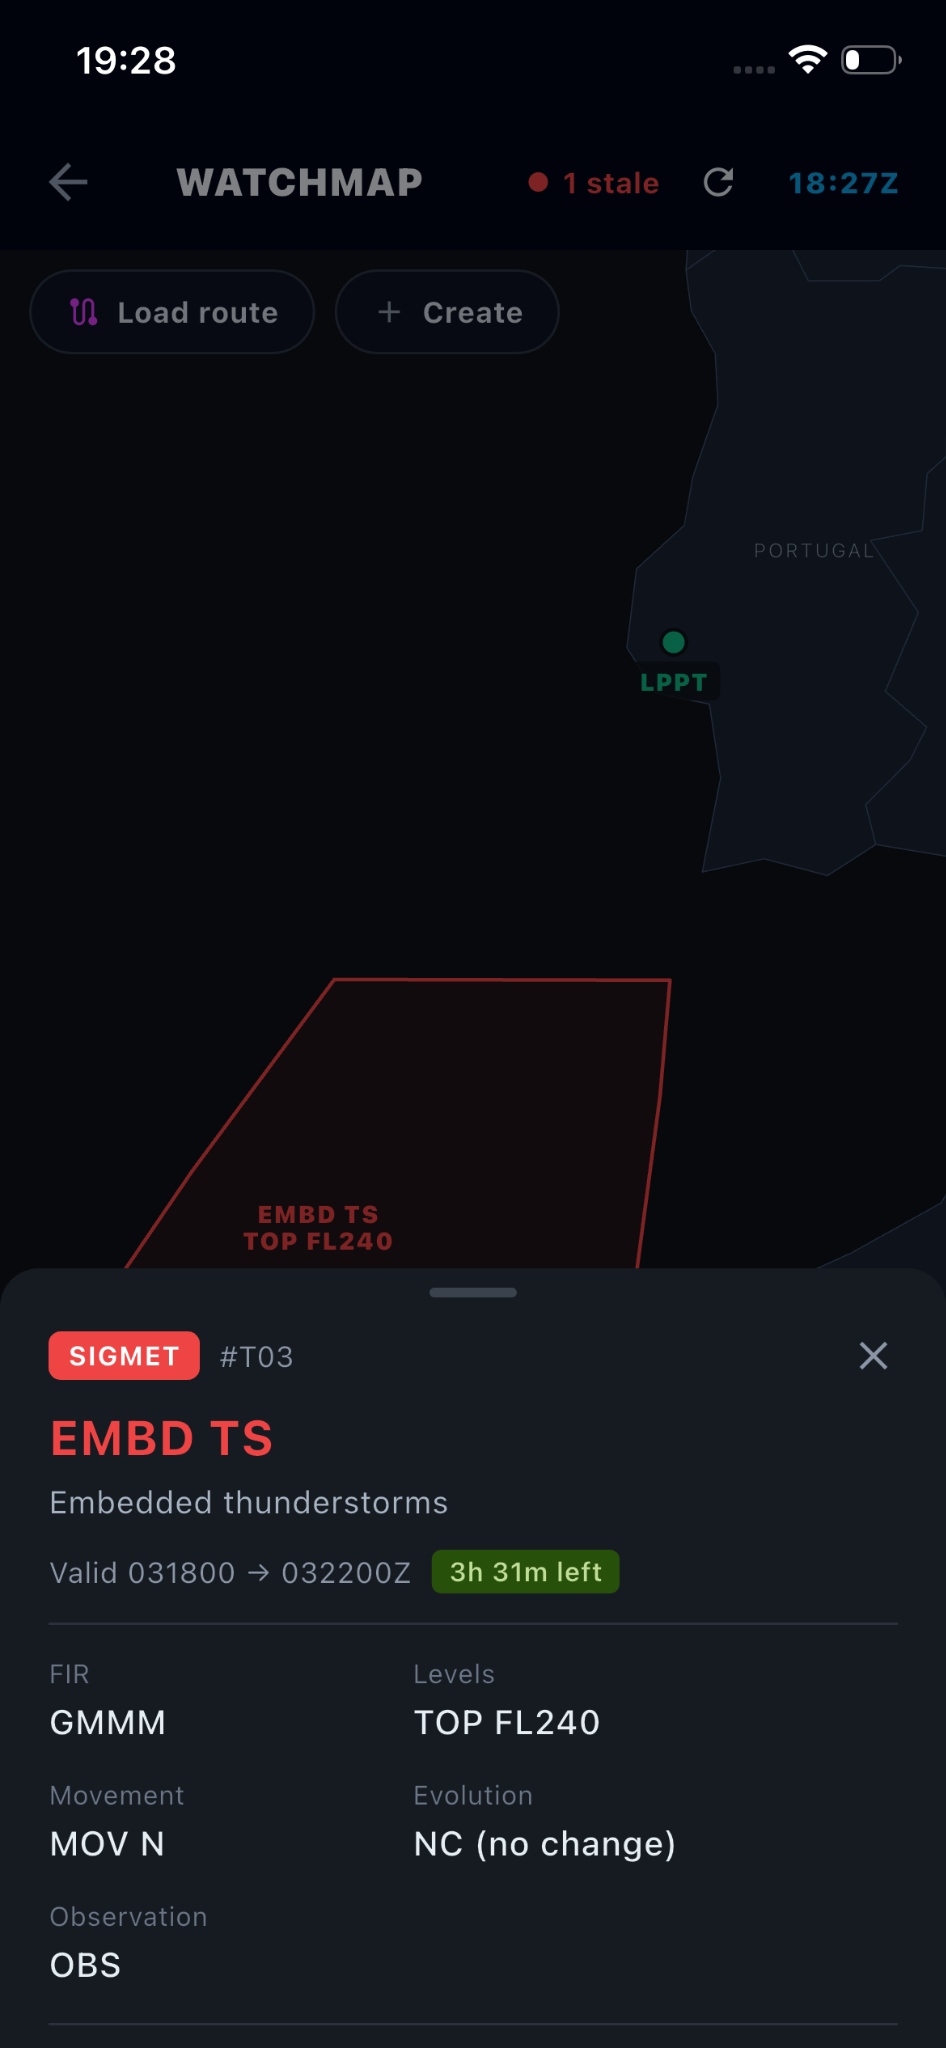
Decoded on the spot: validity countdown, FIR, levels, movement and evolution.
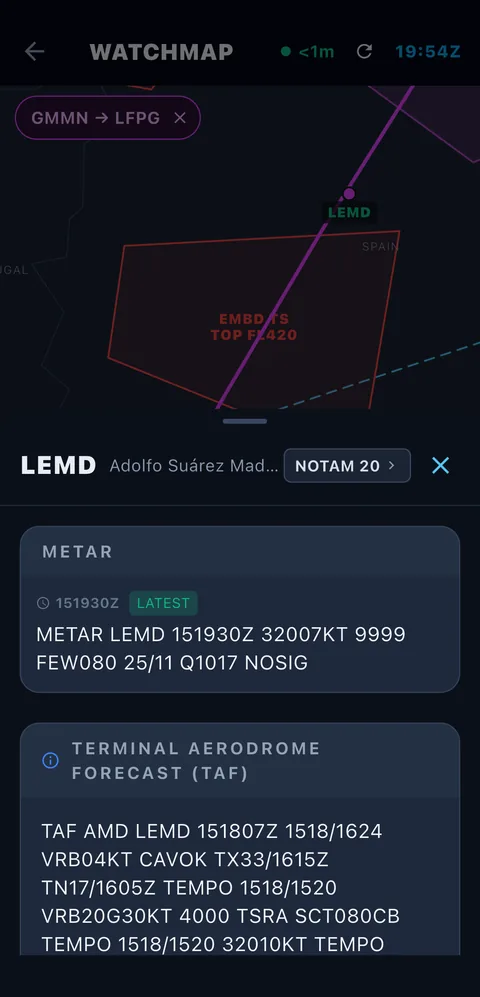
Tap any airport
Raw METAR, raw TAF and the NOTAM count — without leaving the map.
WATCHMAP · DWD + NOAA · SITUATIONAL AWARENESS ONLY
Watchmap · Layers in Context
Route, advisories, icing, turbulence and weather context remain readable together — with authentic source data and the real Watchmap controls kept visible.
Atmospheric Intelligence
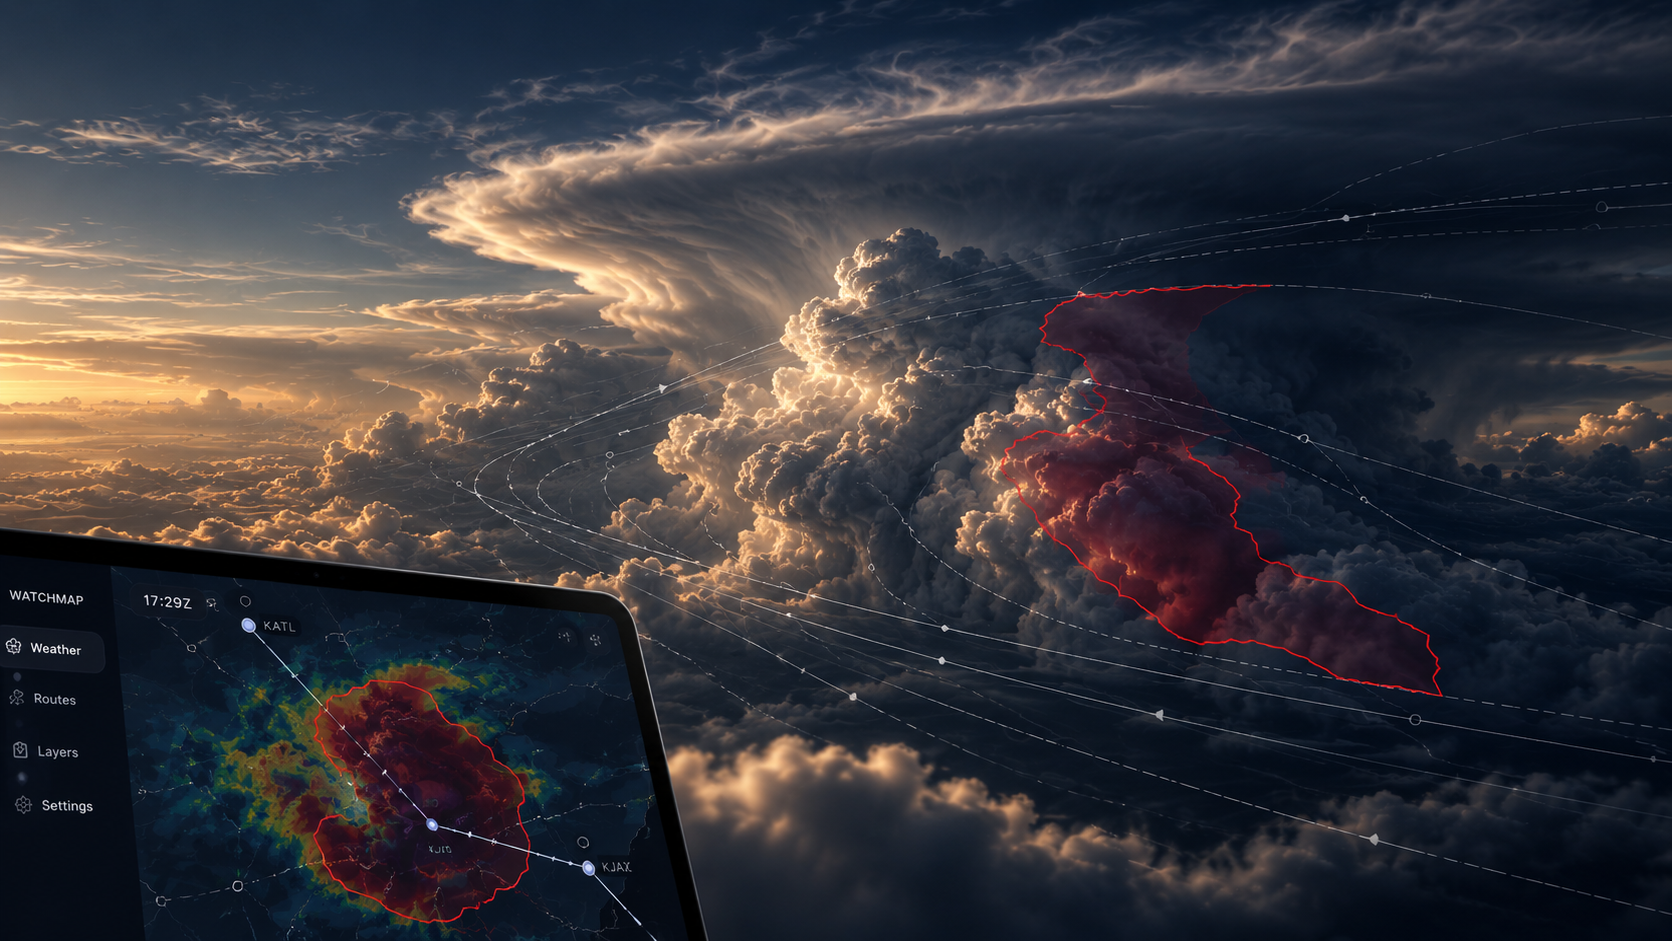
Atmosphere becomes readable structure: flow, boundary and scale. The visual language echoes Watchmap without pretending that brand imagery is operational data.
Airport
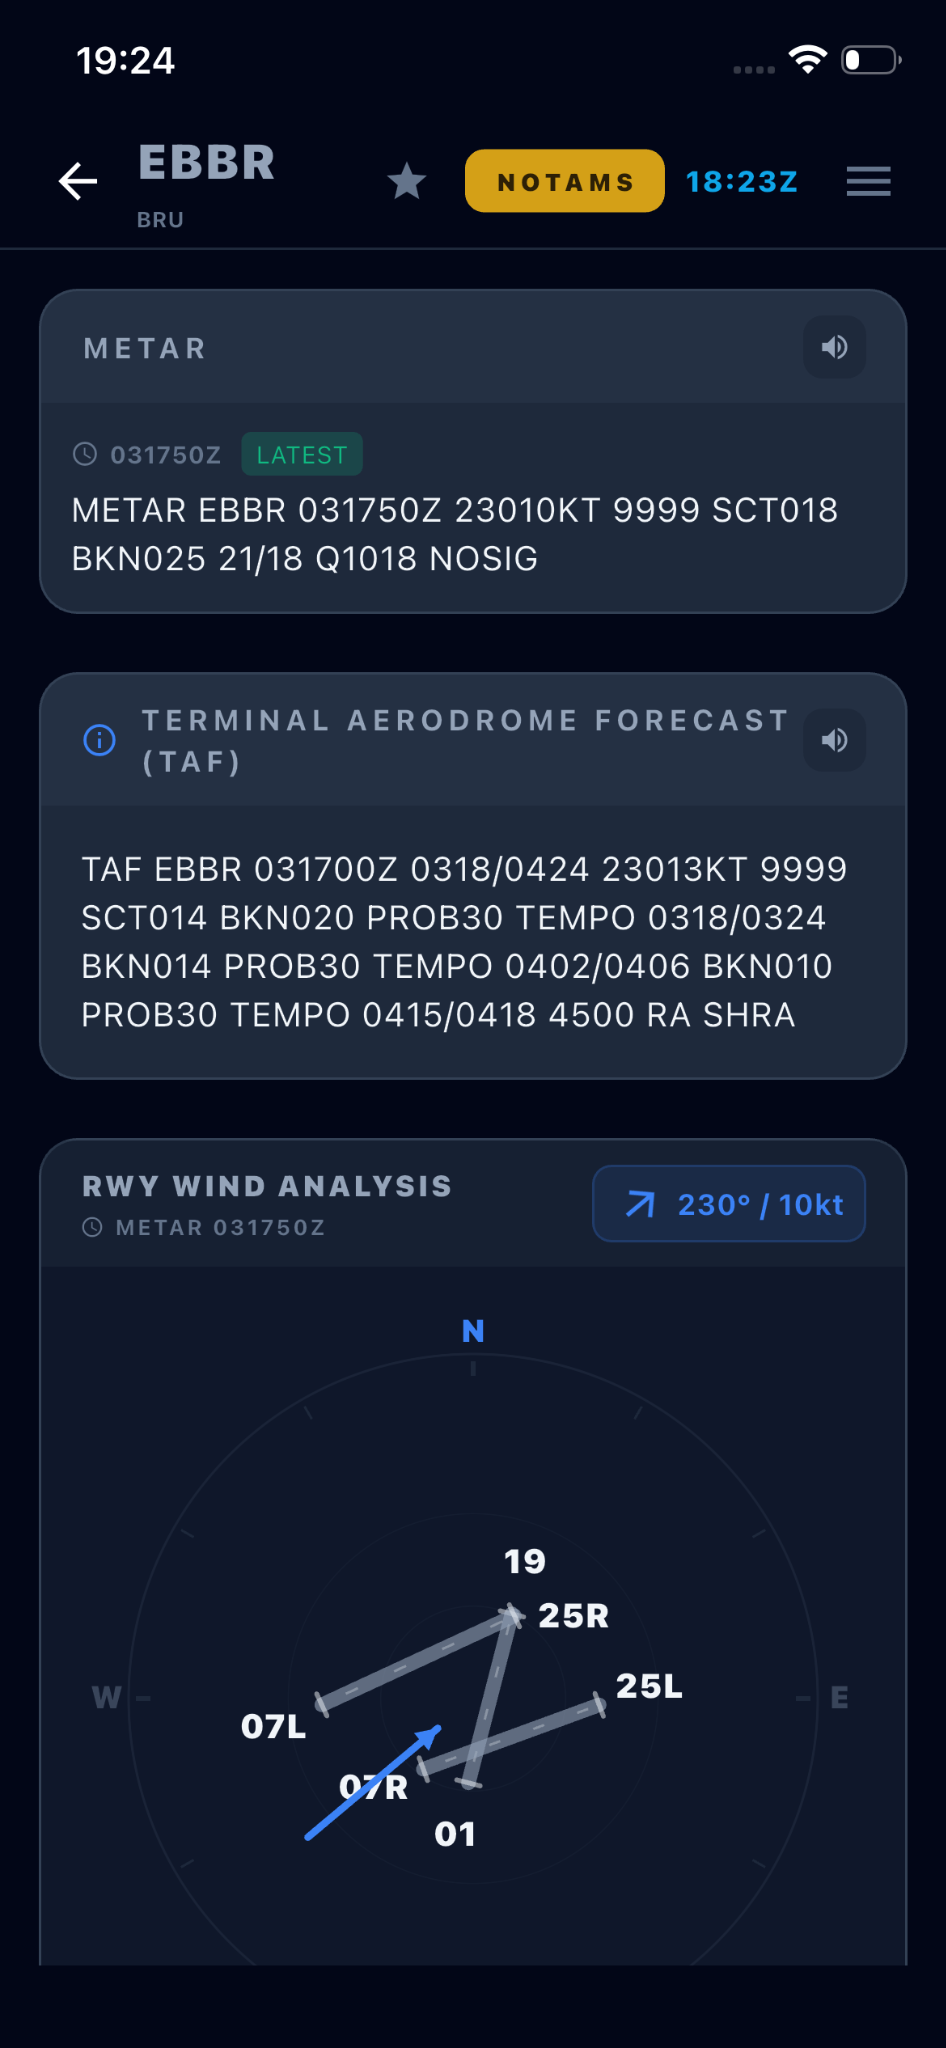
Tap any card and land on one long scroll, always in the same order — a METAR trail with the newest tagged LATEST, the raw TAF, and a runway wind analysis. A speaker button reads the report aloud. Your eye learns the layout once and never hunts again.
Raw METAR. Raw TAF. Runway-wind geometry. Source timestamps that let the pilot judge the age of what is on screen. When cached or older data is being shown, the product is designed to make that state explicit rather than silently present it as current.
Operational depth
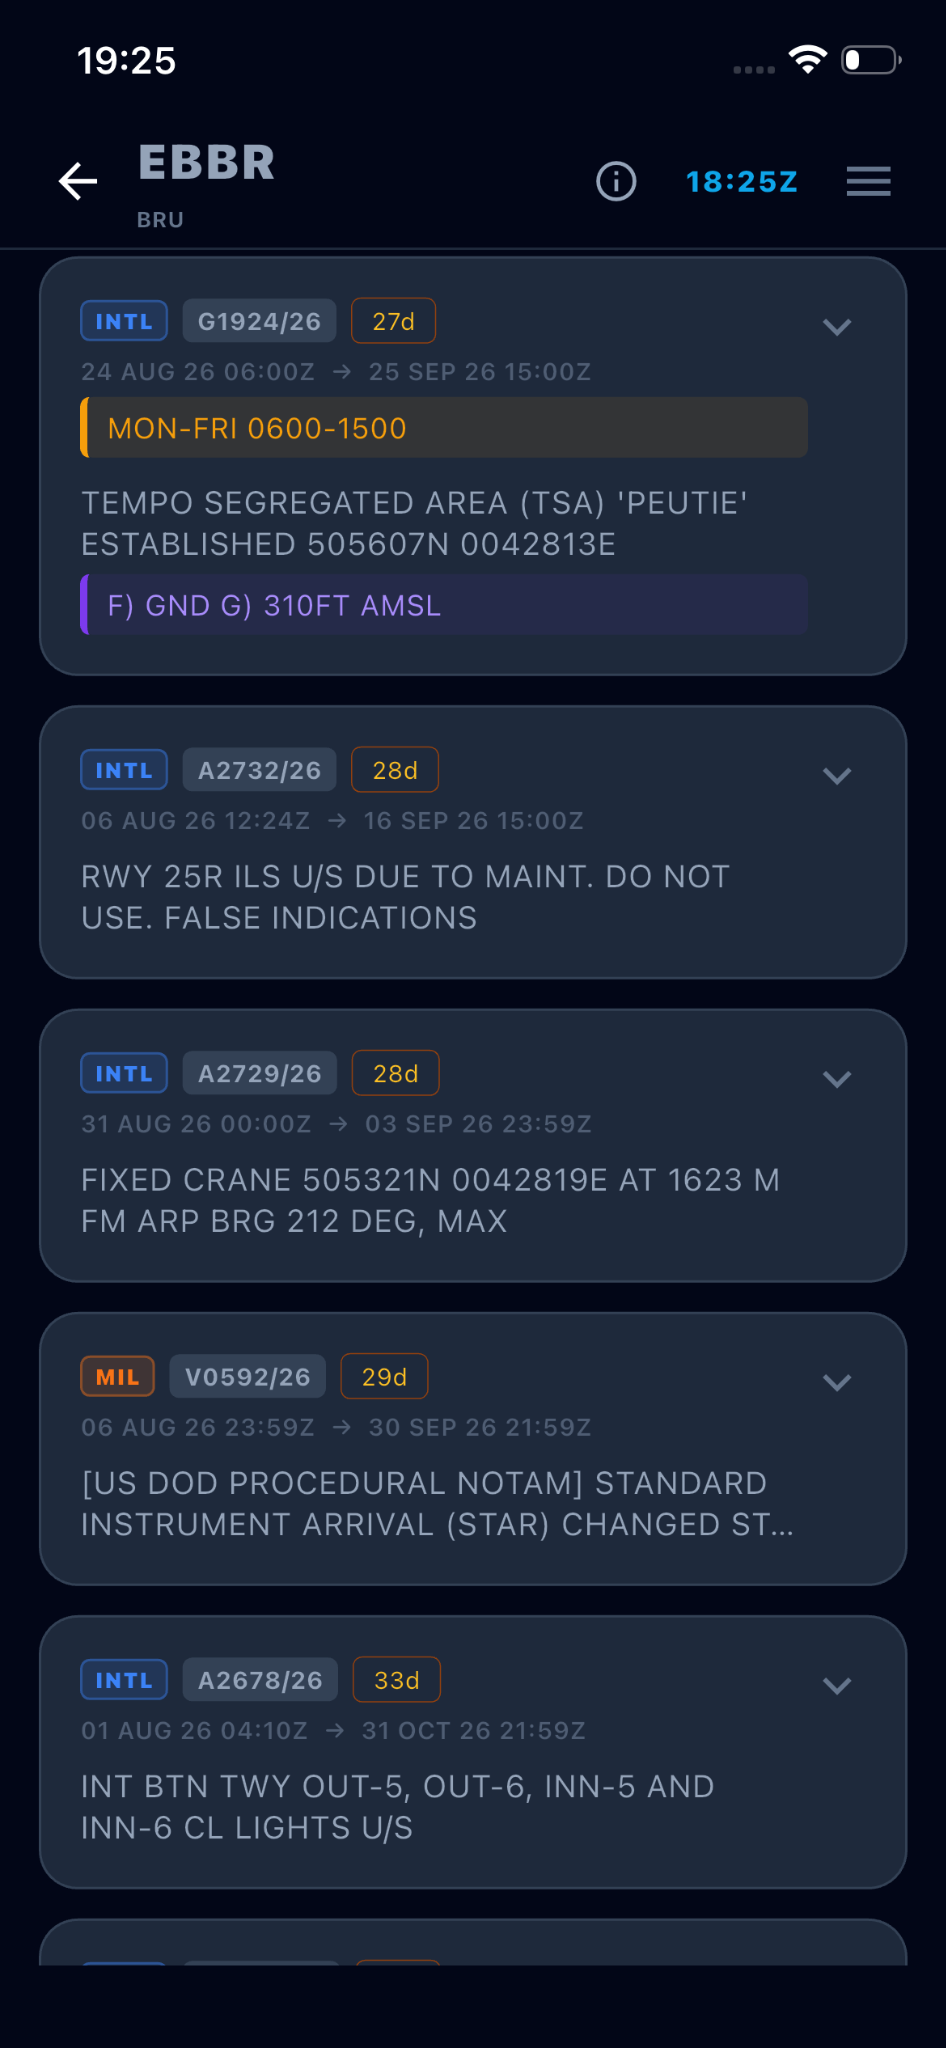
Split the way your briefing is: what affects the aerodrome, and what affects the airspace you’ll cross. Straight from the FAA Notice to Air Missions System and shown byte-for-byte — never reworded, never summarised.
SIGMET, AIRMET, GAMET, volcanic ash and tropical cyclone — each family keeps one colour everywhere, on the chips, the cards and the map polygons. Filter to what matters, then view any hazard in its geographic context.
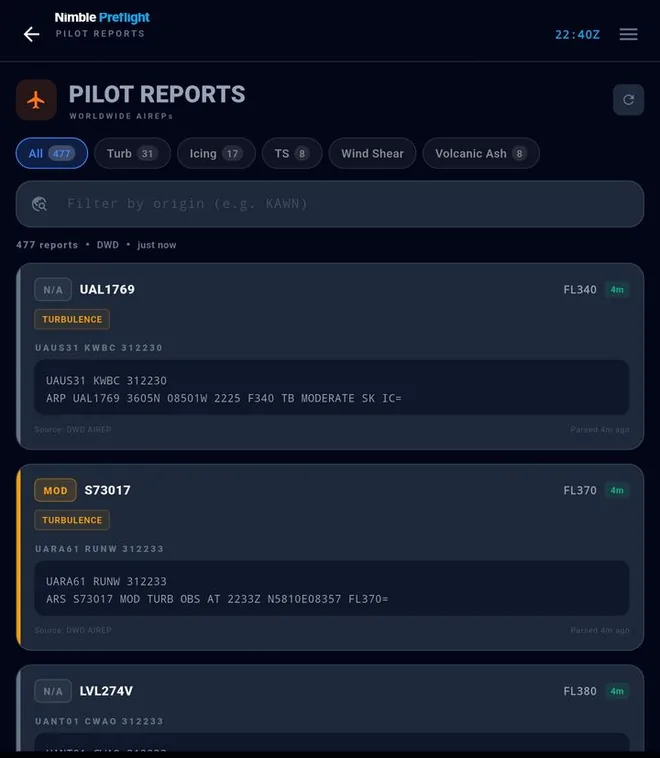
AIREPs and PIREPs from crews actually in the conditions they describe. A chart tells you where turbulence is expected; a pilot report tells you an aircraft got it — at a time, a level and a position. The screen you check when forecast and reality might be diverging.
WX Charts
Not variations on one picture — each tab answers a different question, and knowing which one to reach for is most of the skill.
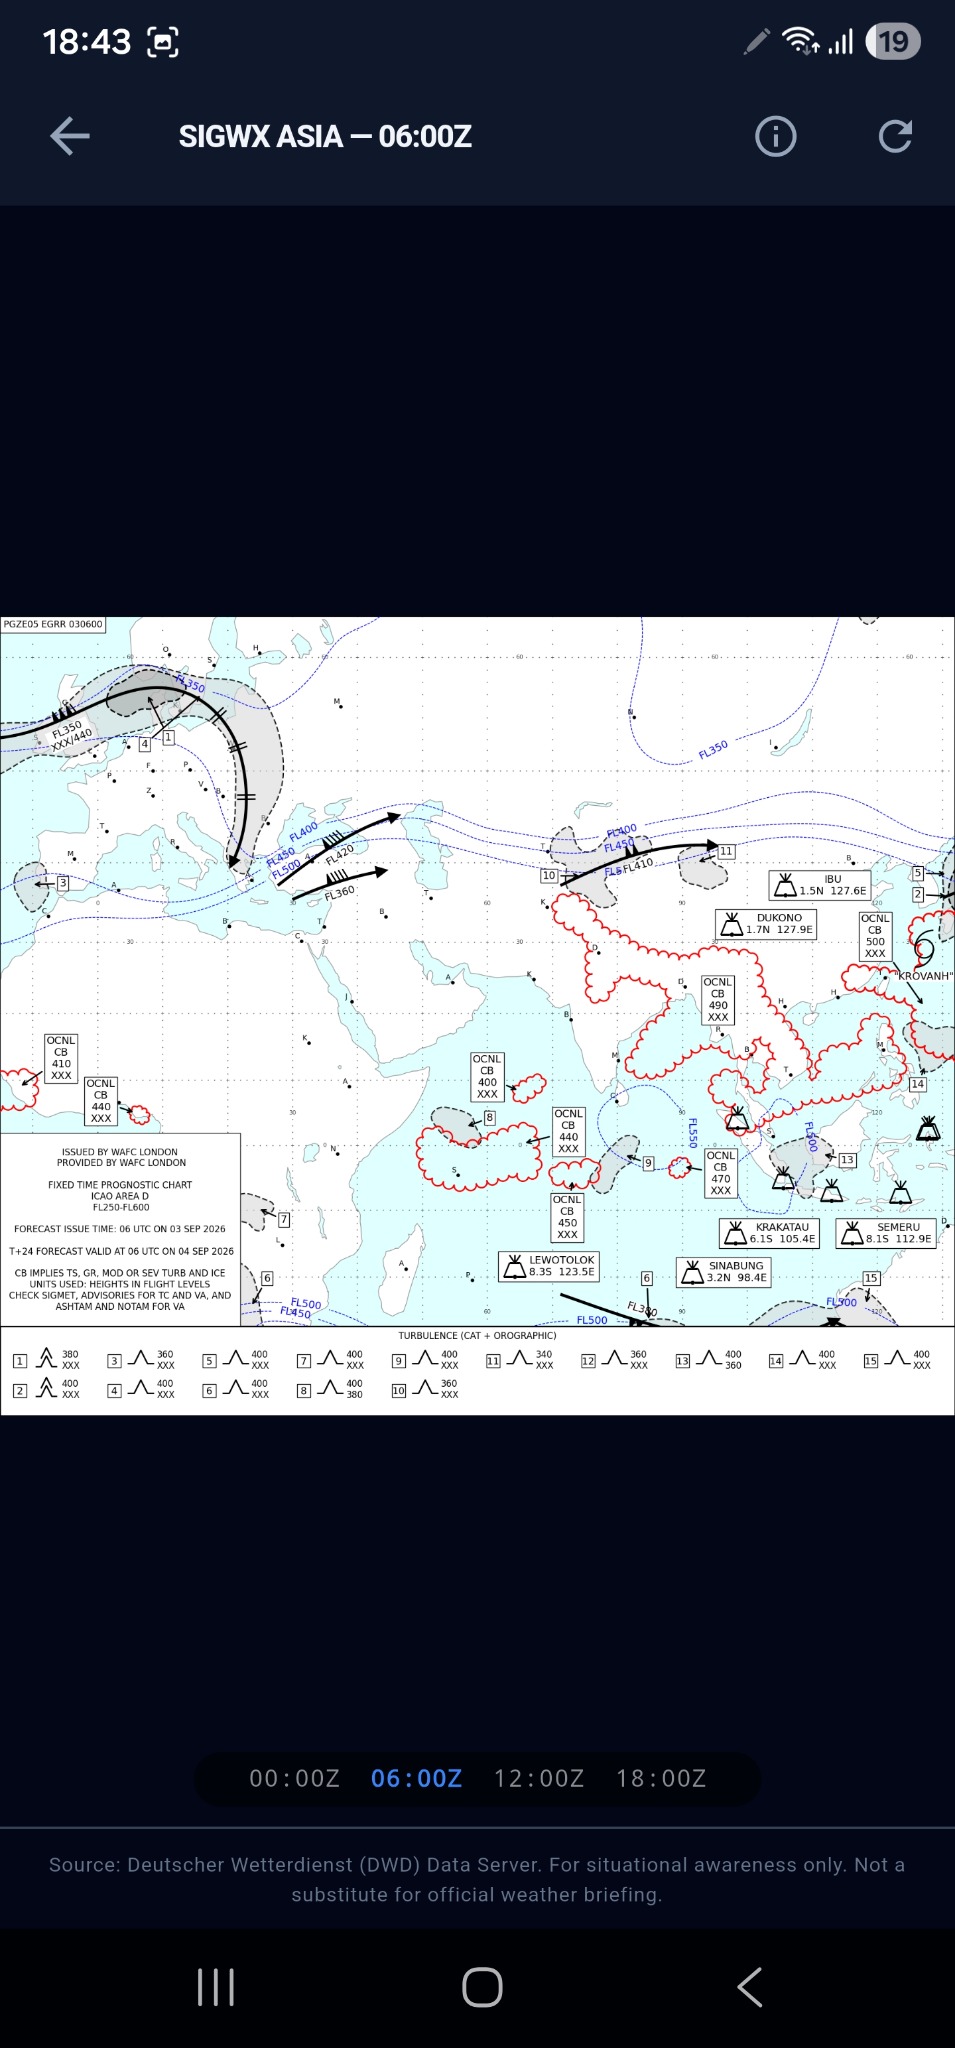
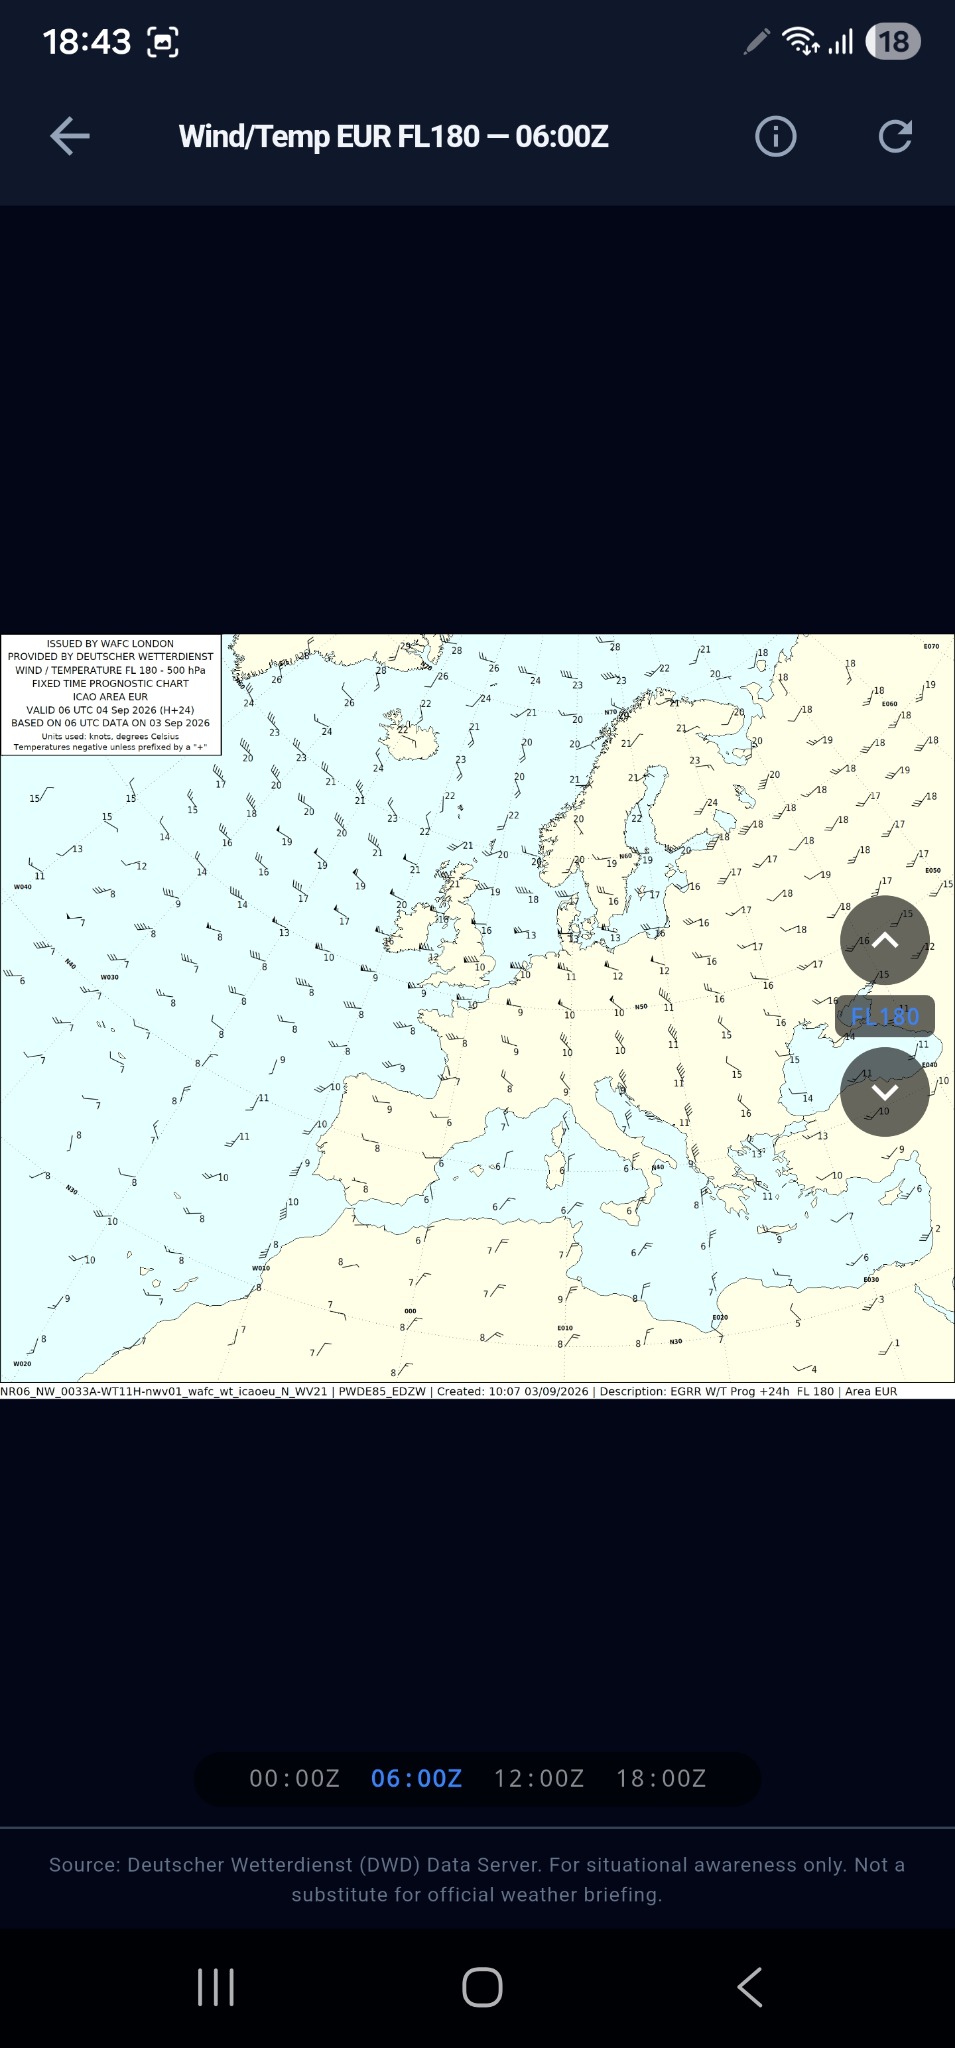
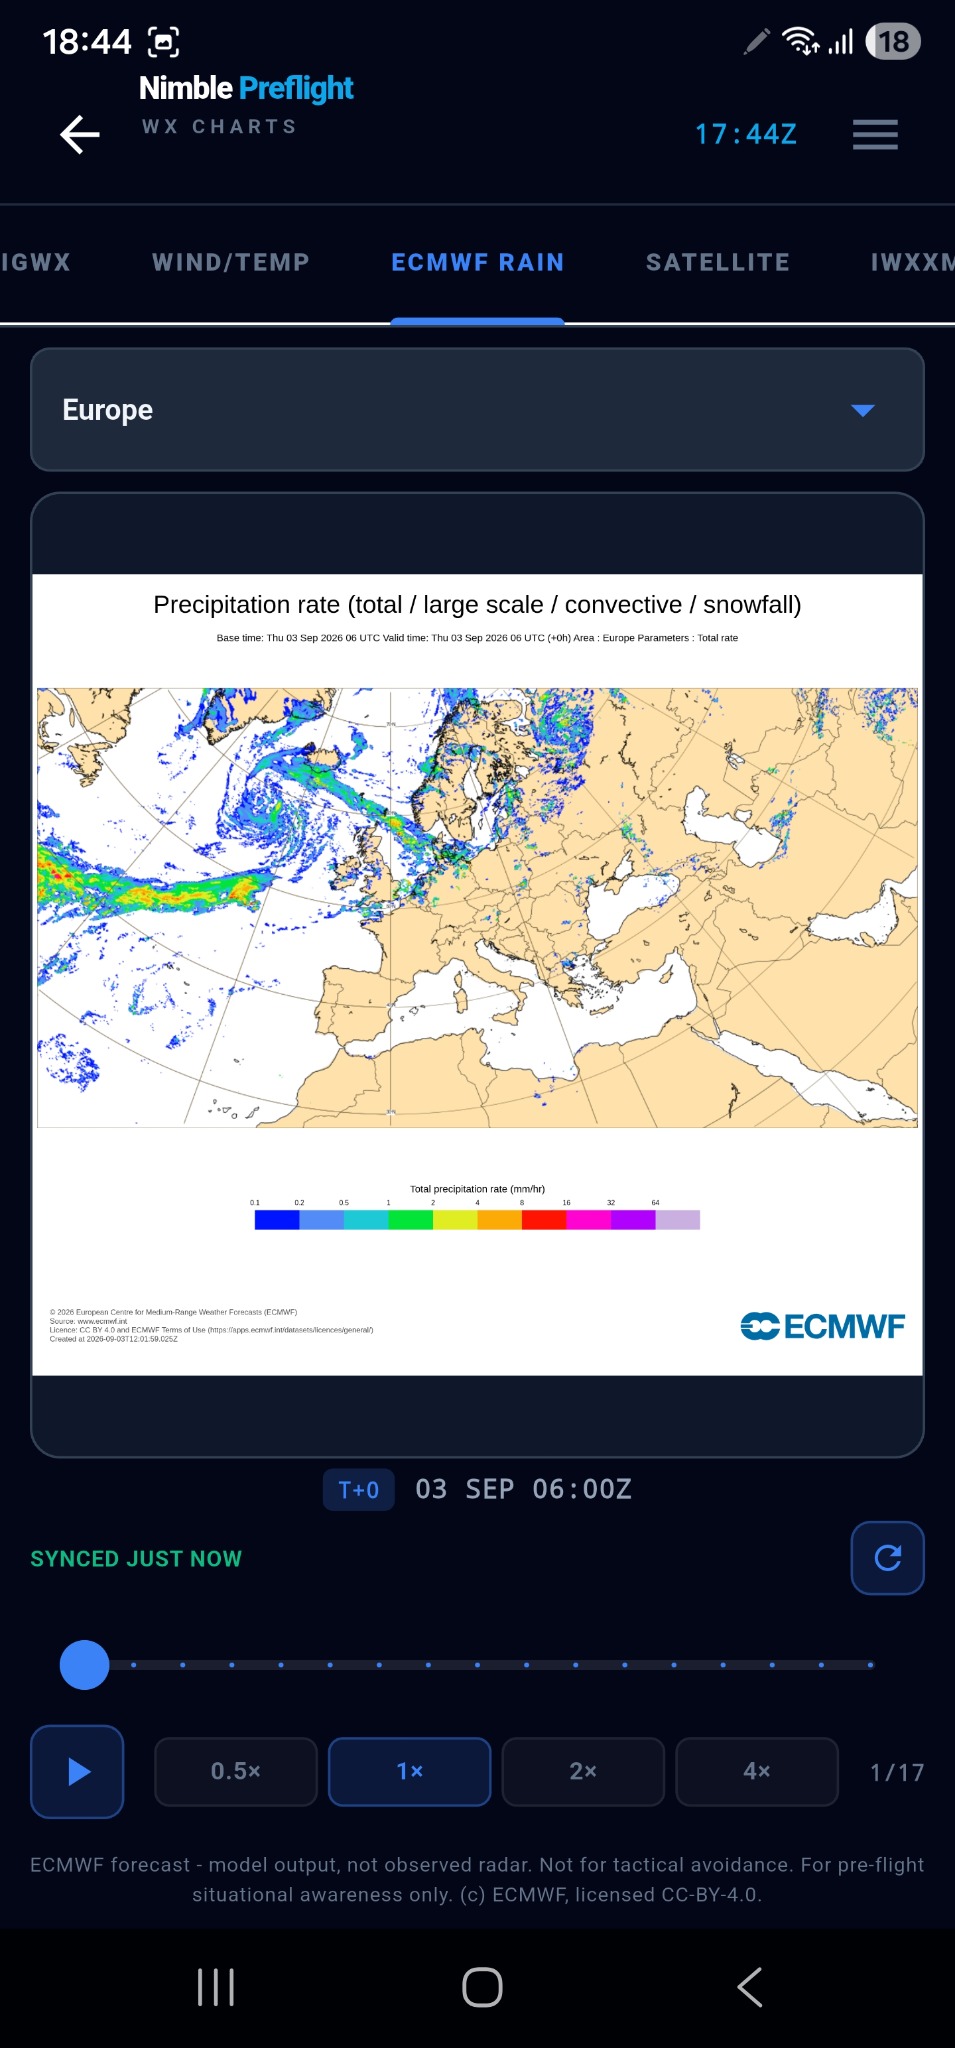
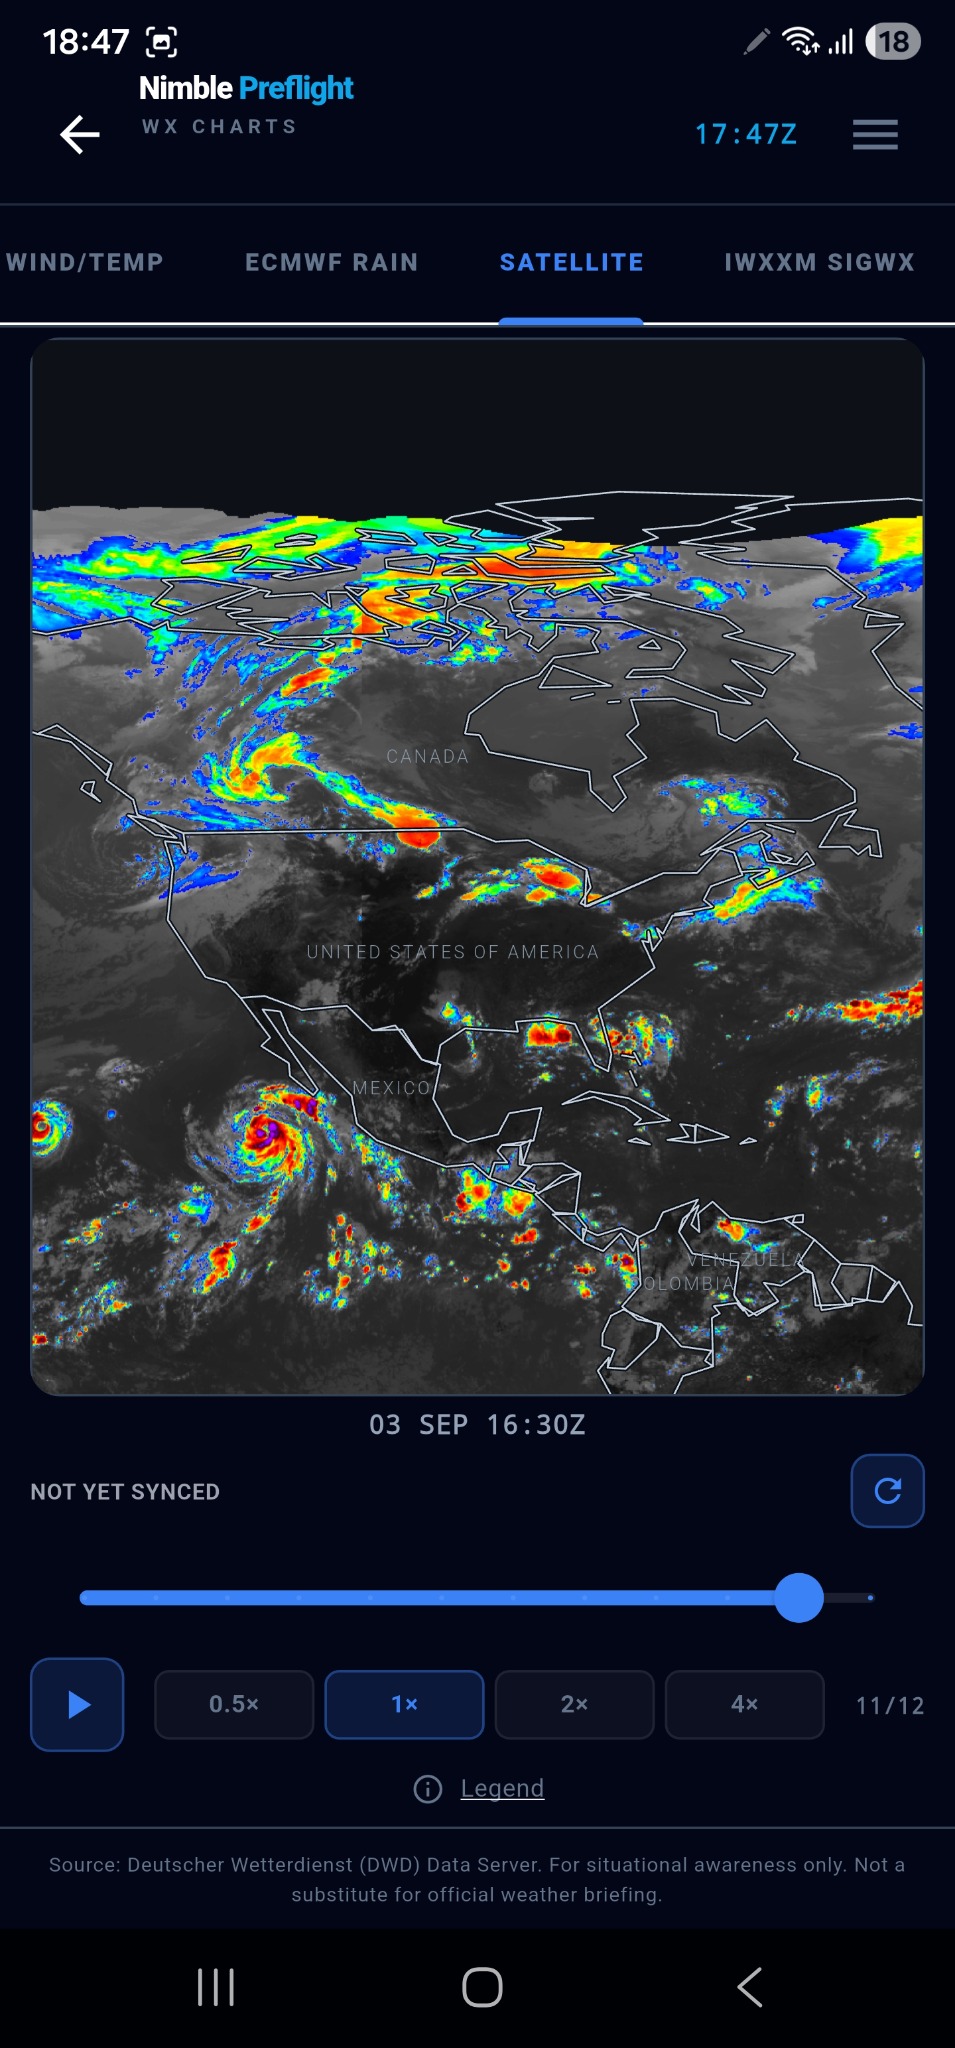
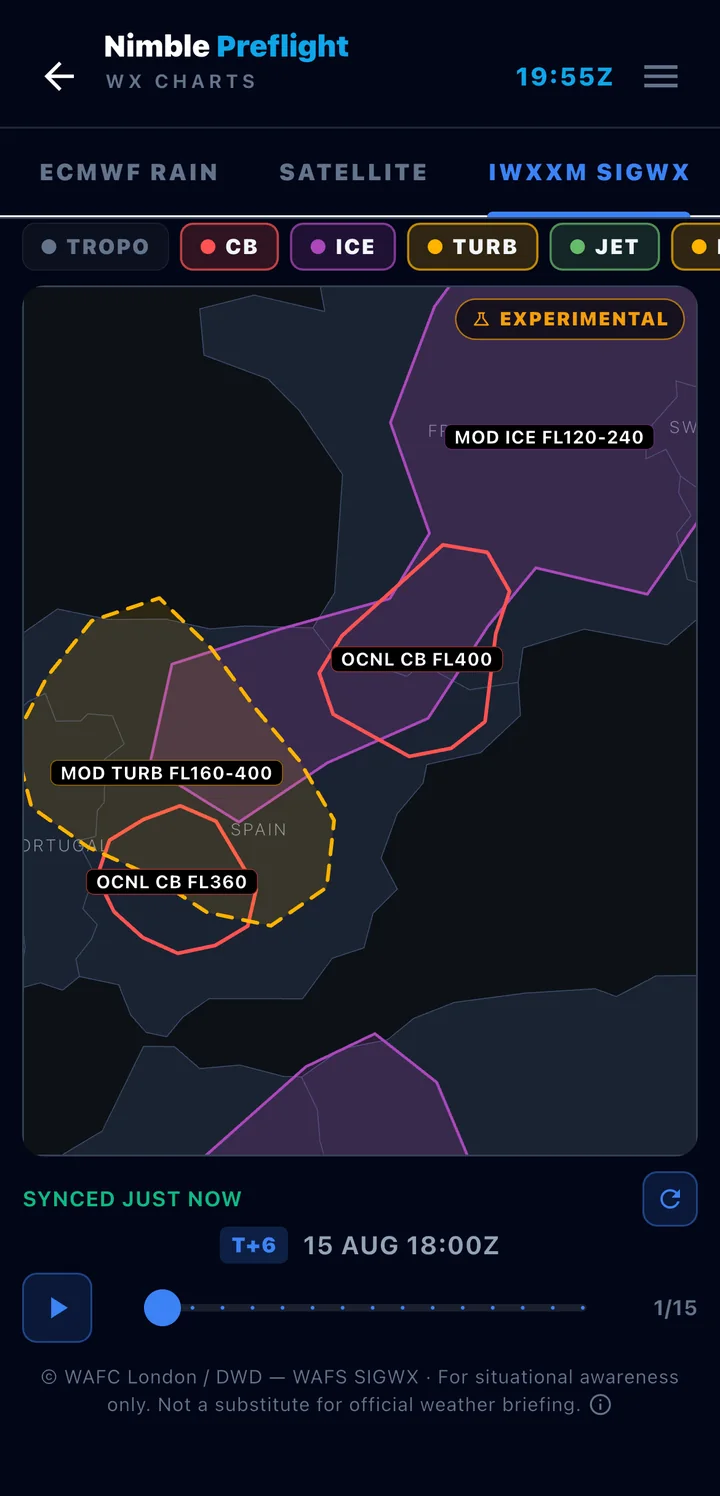
Chart and satellite imagery © Deutscher Wetterdienst (DWD) and ECMWF, used under licence — reproduced for situational awareness only.

Human Life · Night Before
Preparation is not one place or one lighting condition. Nimble belongs in the quiet moments before duty as naturally as it does in the crew room or at the gate.
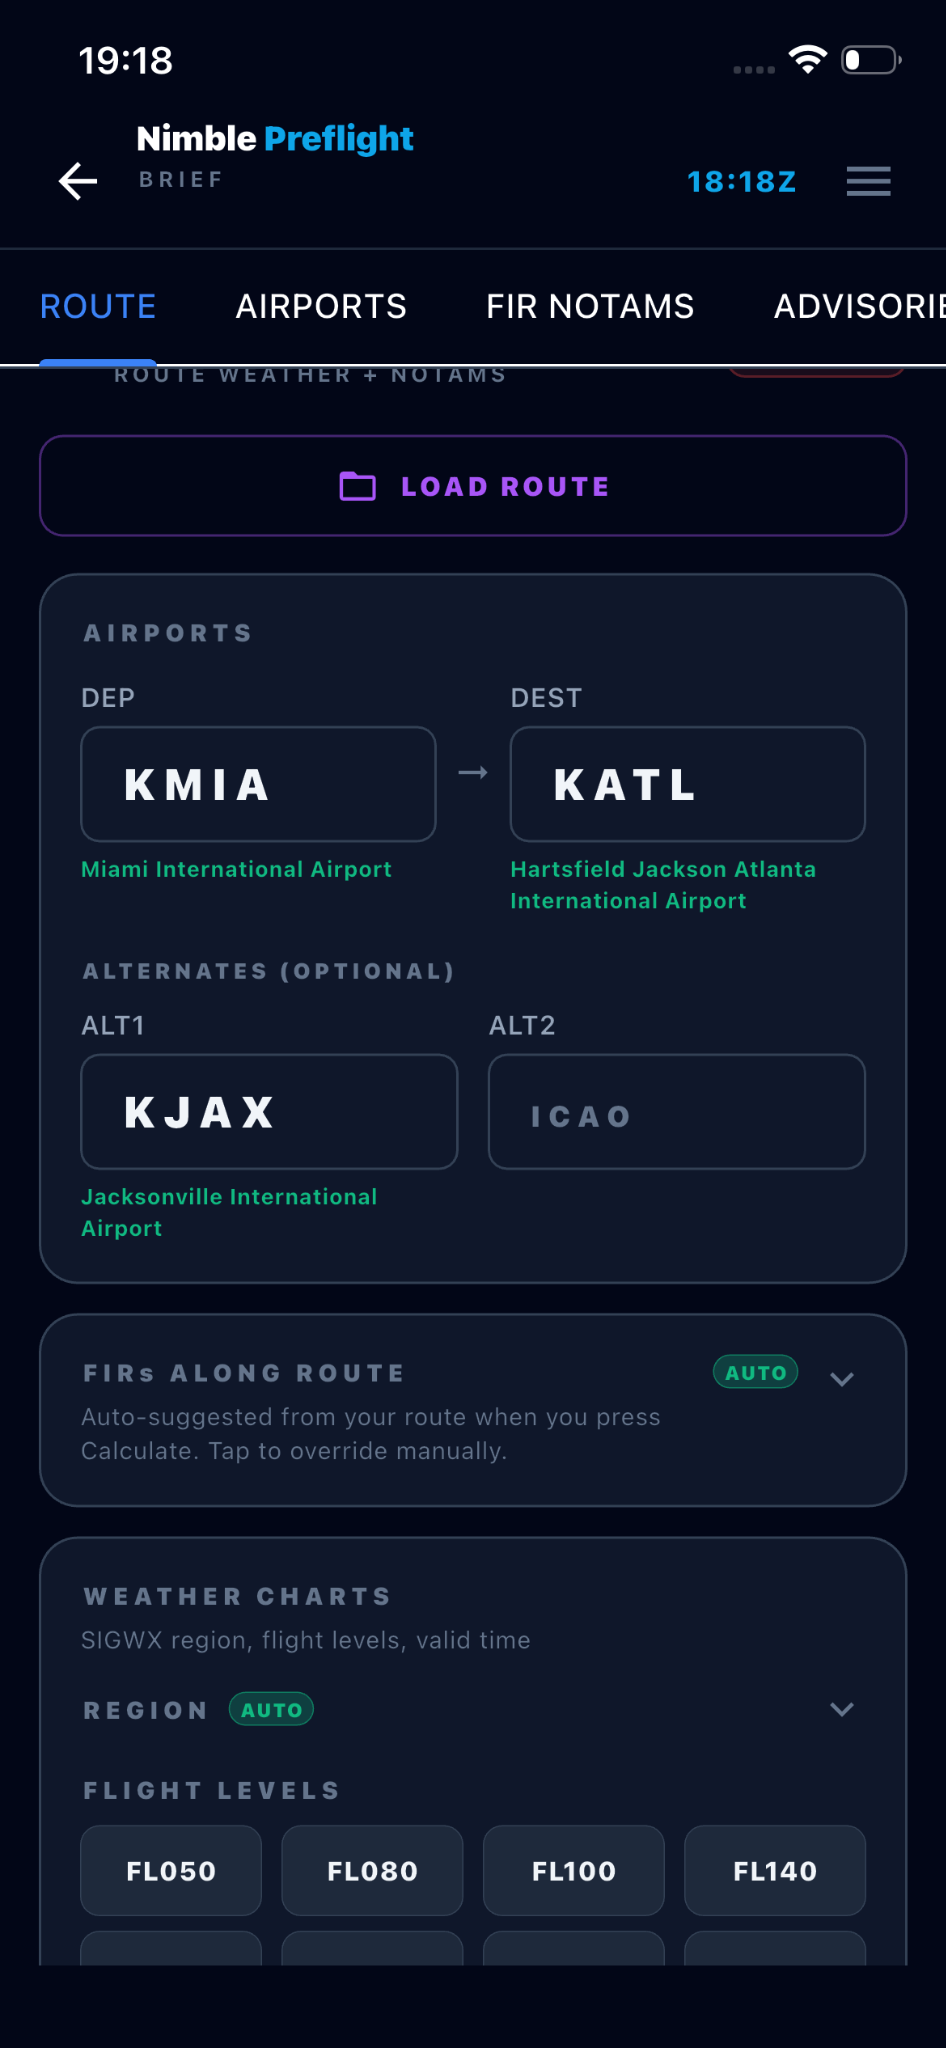
Brief
Give it a departure, a destination and your alternates — Brief pulls the whole picture together into a single pack you can save and reuse.
Along your route
One briefing — three ways
Nimble Brief is a reference workflow. It does not replace official operational flight planning or the official briefing required for the flight.
Brief · Watchmap

Human Life · Between Sectors
A short, calm check in the middle of the working day — the moment the next picture has to come back together.
Flight Watch
Not a radar screen, not a fleet display — Flight Watch follows the one aircraft you actually need to know about: the inbound you’re taking over, the positioning flight that decides when your duty starts, the aircraft carrying your crew, a family arrival.
Flight tracking is for situational awareness only and can be delayed, incomplete or unavailable depending on coverage and source availability.
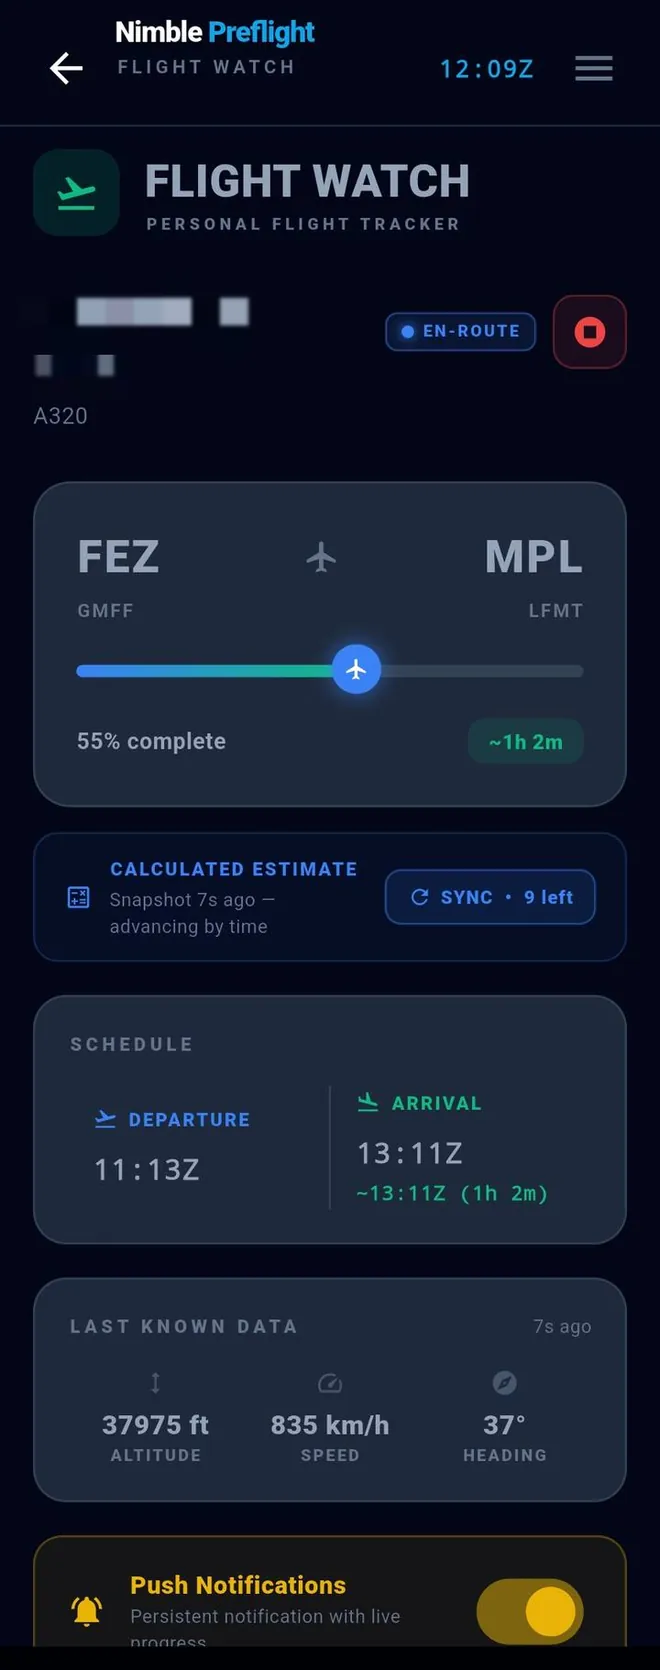
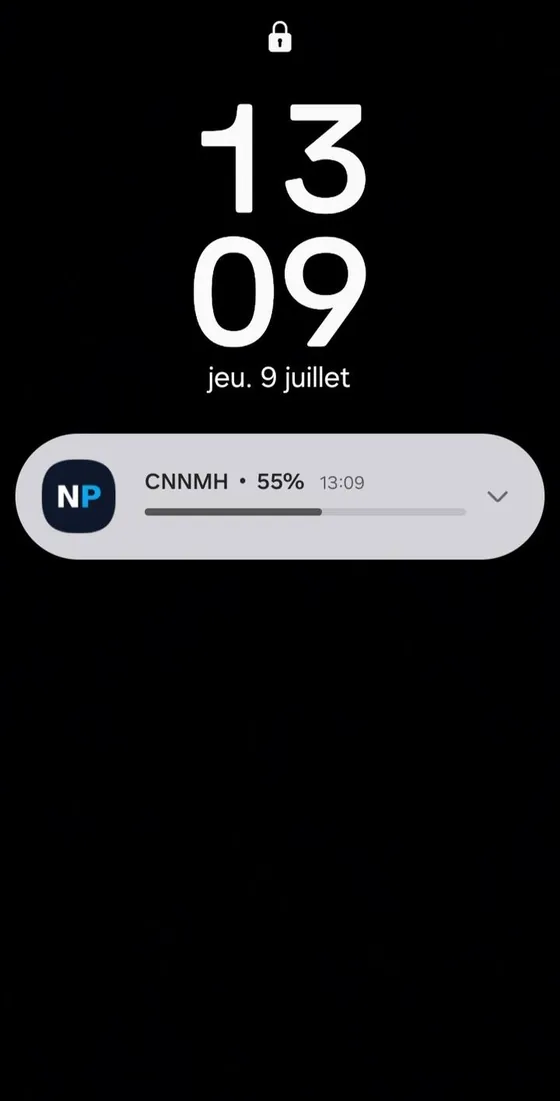
Push notifications
Flight and percentage in the title, route and remaining time in the body — updated every minute, no need to reopen the app. And Flight Watch is the only feature that can send you a notification. Nothing else — not weather, not NOTAMs, not advisories — will ever interrupt you. While driving to the airport, you might just have time to grab a coffee on the way.
Dual-source resilience
Two independent weather authorities, with automatic failover. When one source went dark in a real NOAA outage, the app kept briefing — because it already had a second.
NOAA · FAA · Deutscher Wetterdienst · ECMWF · Flightradar24
Pilot toolkit
The numbers you’d otherwise run on a phone calculator or the back of a jepp chart — each answering one question a line pilot actually asks, results saved straight to your repository.
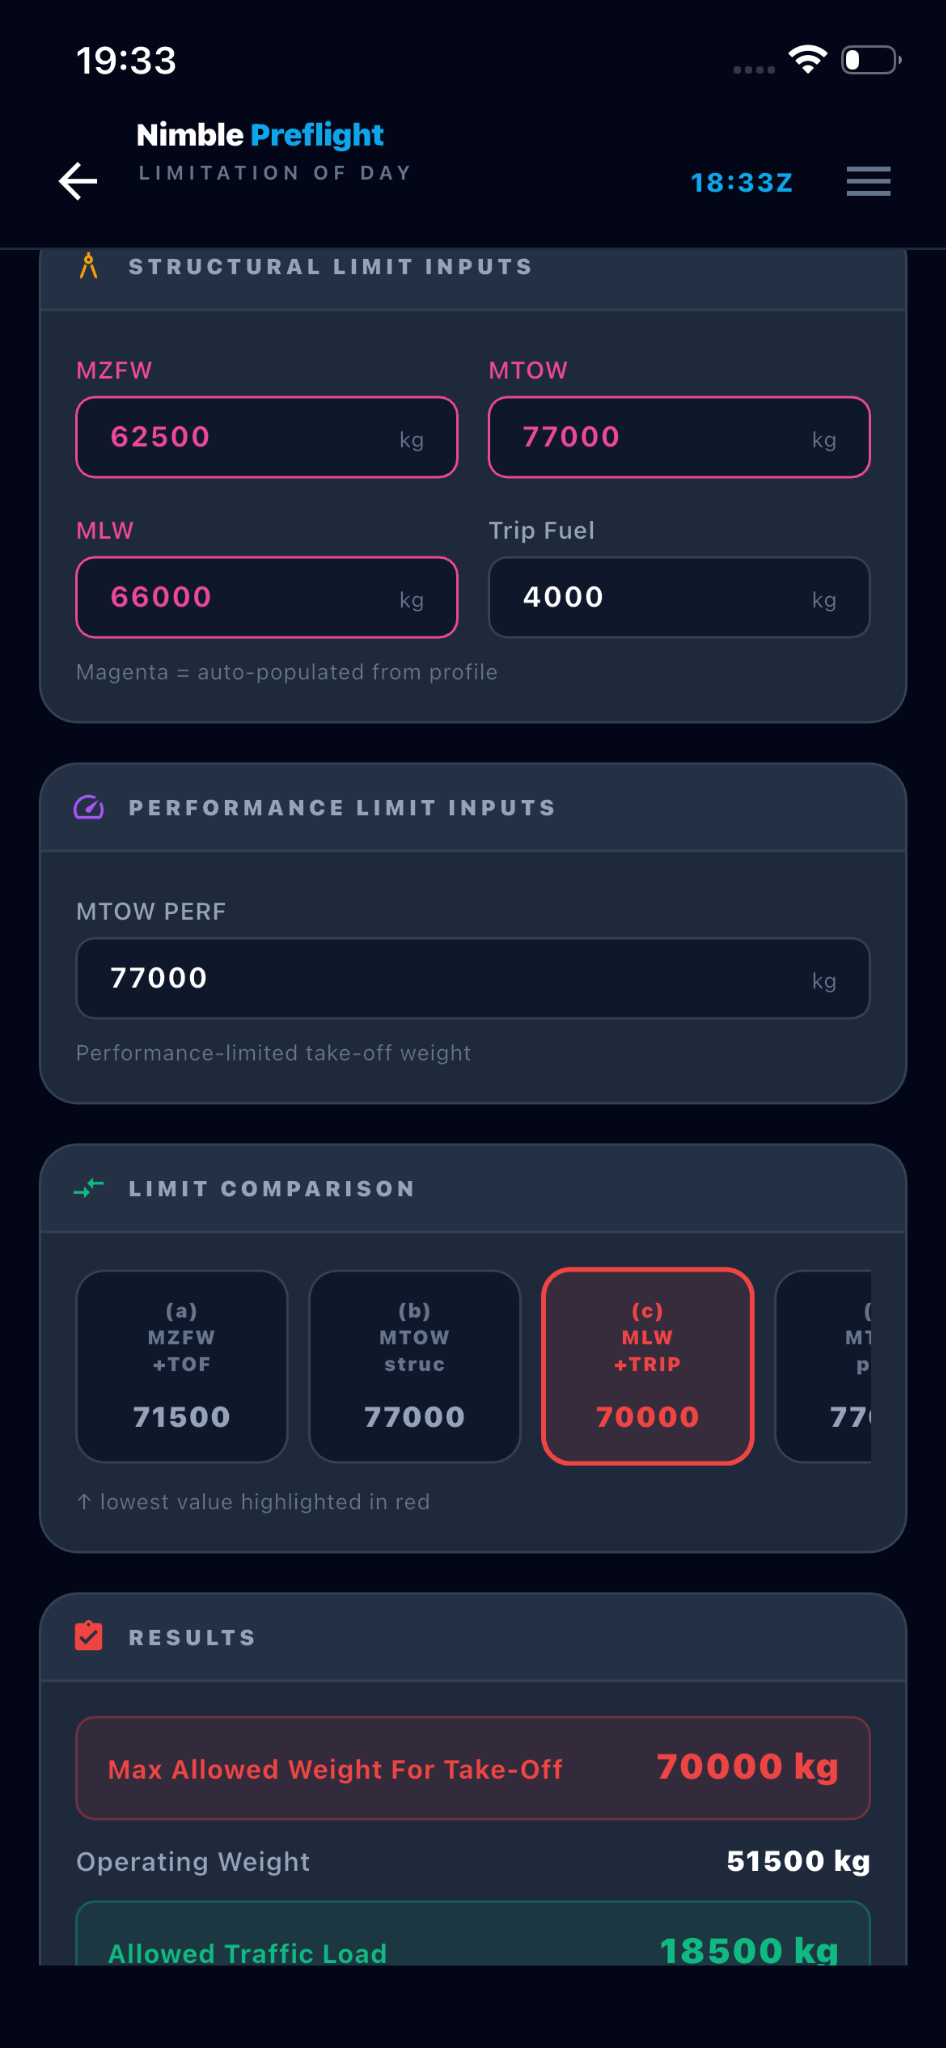
“What’s my maximum take-off weight today, and what traffic load does that leave?” Build the operating weight, enter the limits, and read what the day allows — four candidate limits compared, the lowest in red.
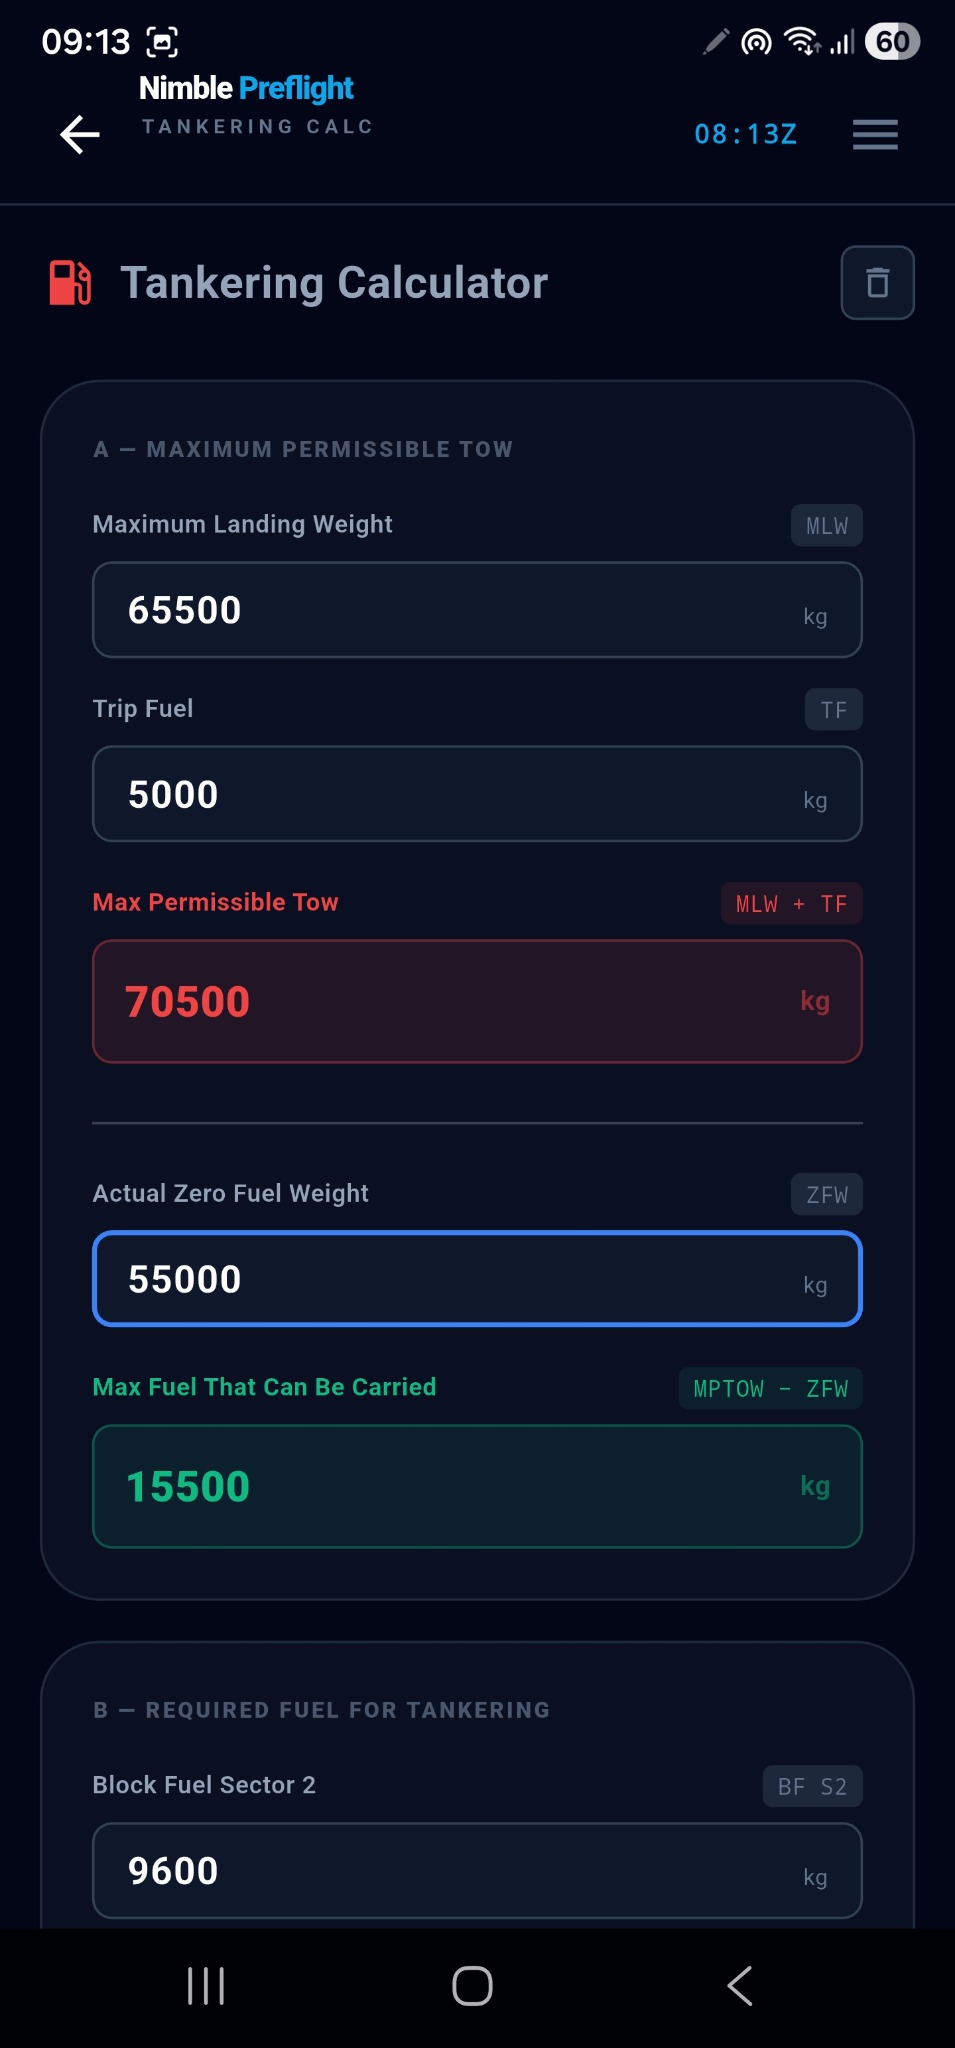
“How much extra fuel can I legally carry, and how much do I need for two sectors?” The limit in red, the usable fuel in green.
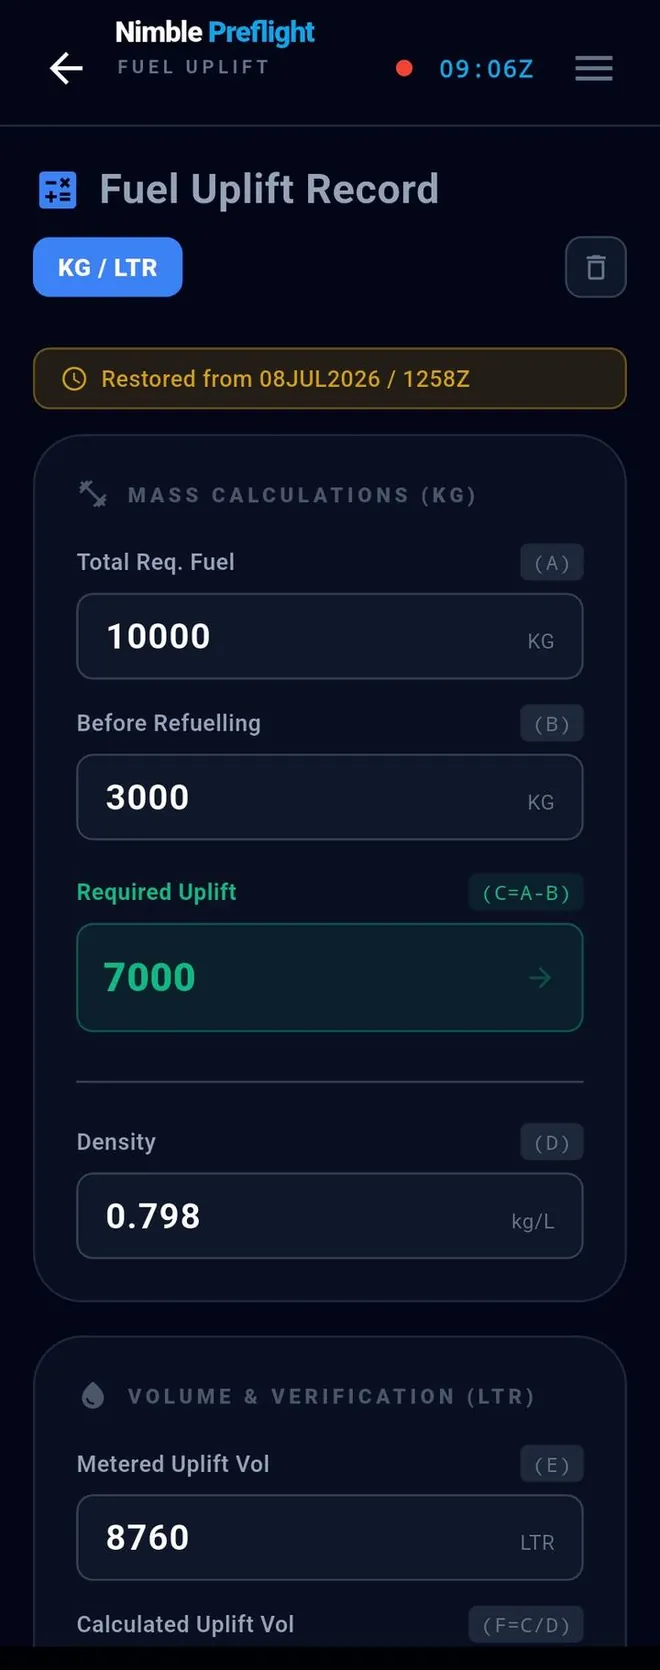
“Does the metered volume match the fuel I actually needed?” Mass first, then volume, then the discrepancy — in both units.
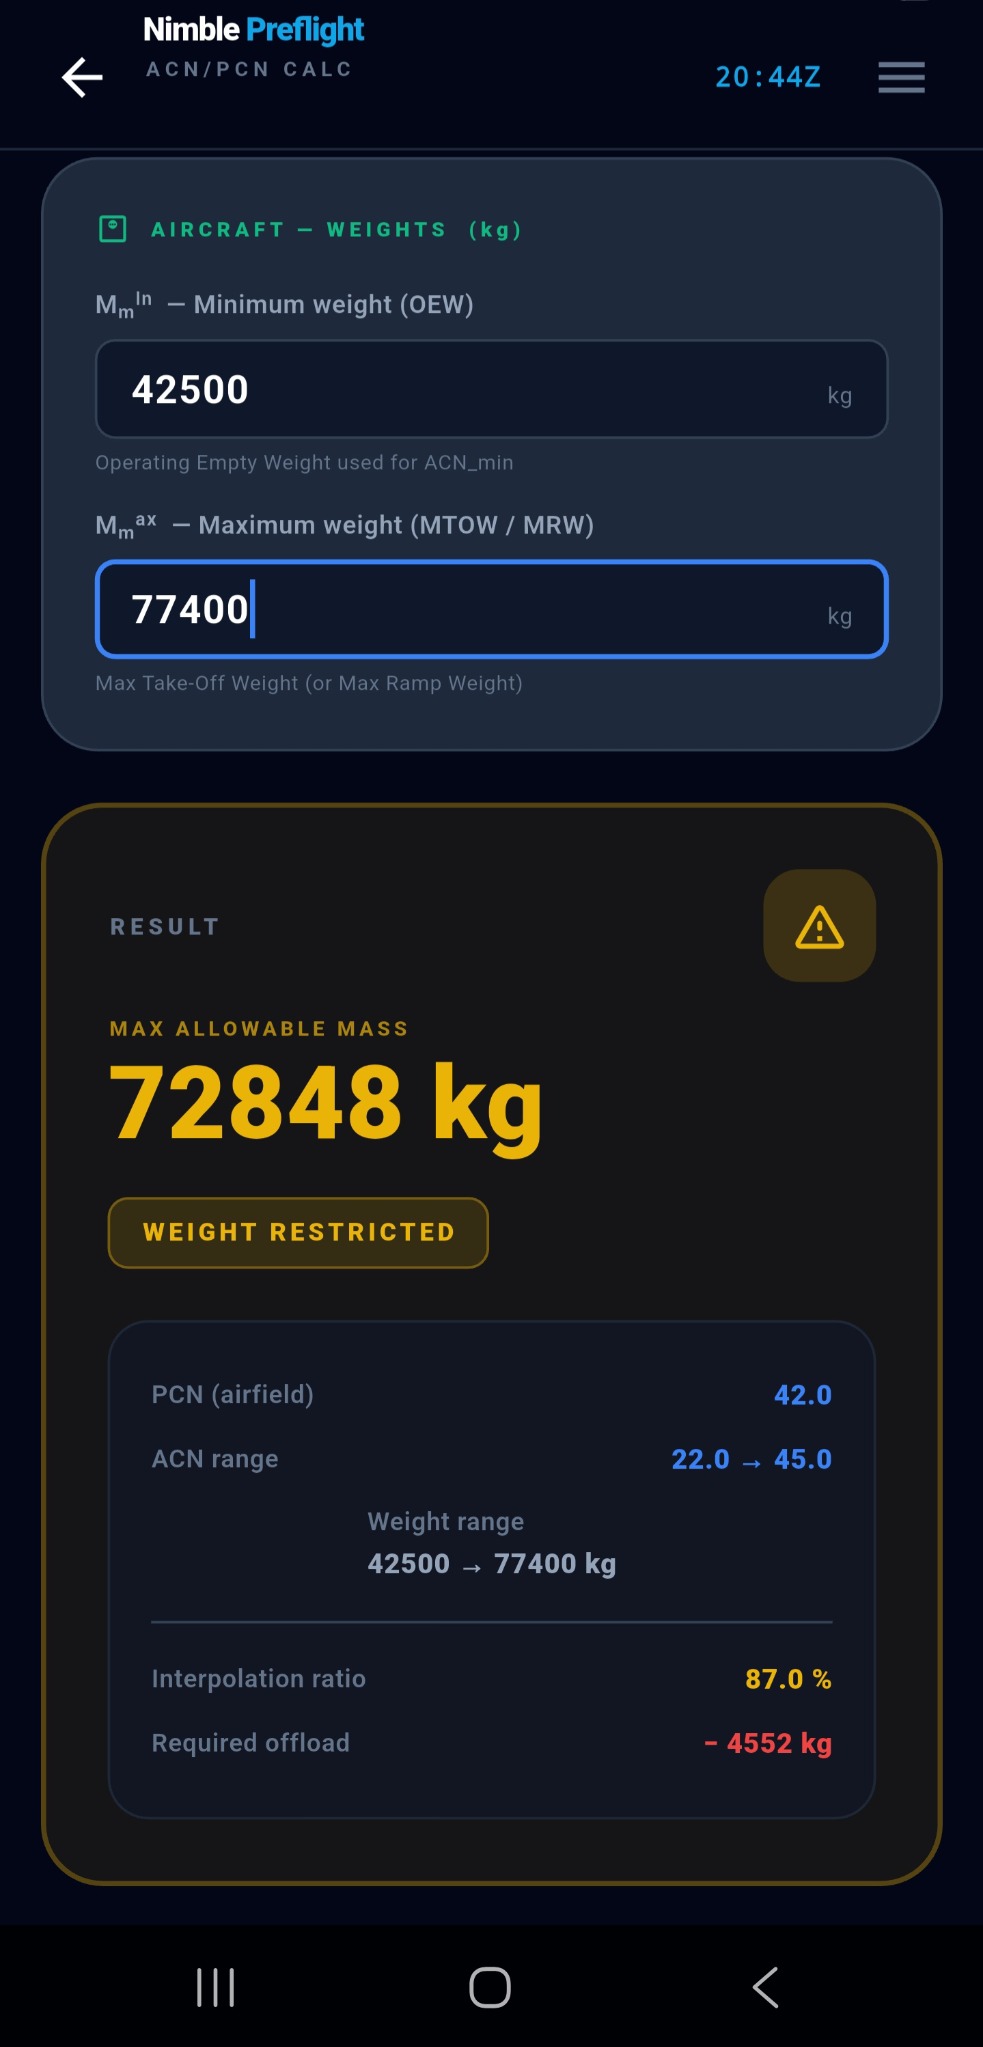
“Can this pavement take my aircraft at weight?” The verdict, the interpolation ratio, and any required offload.
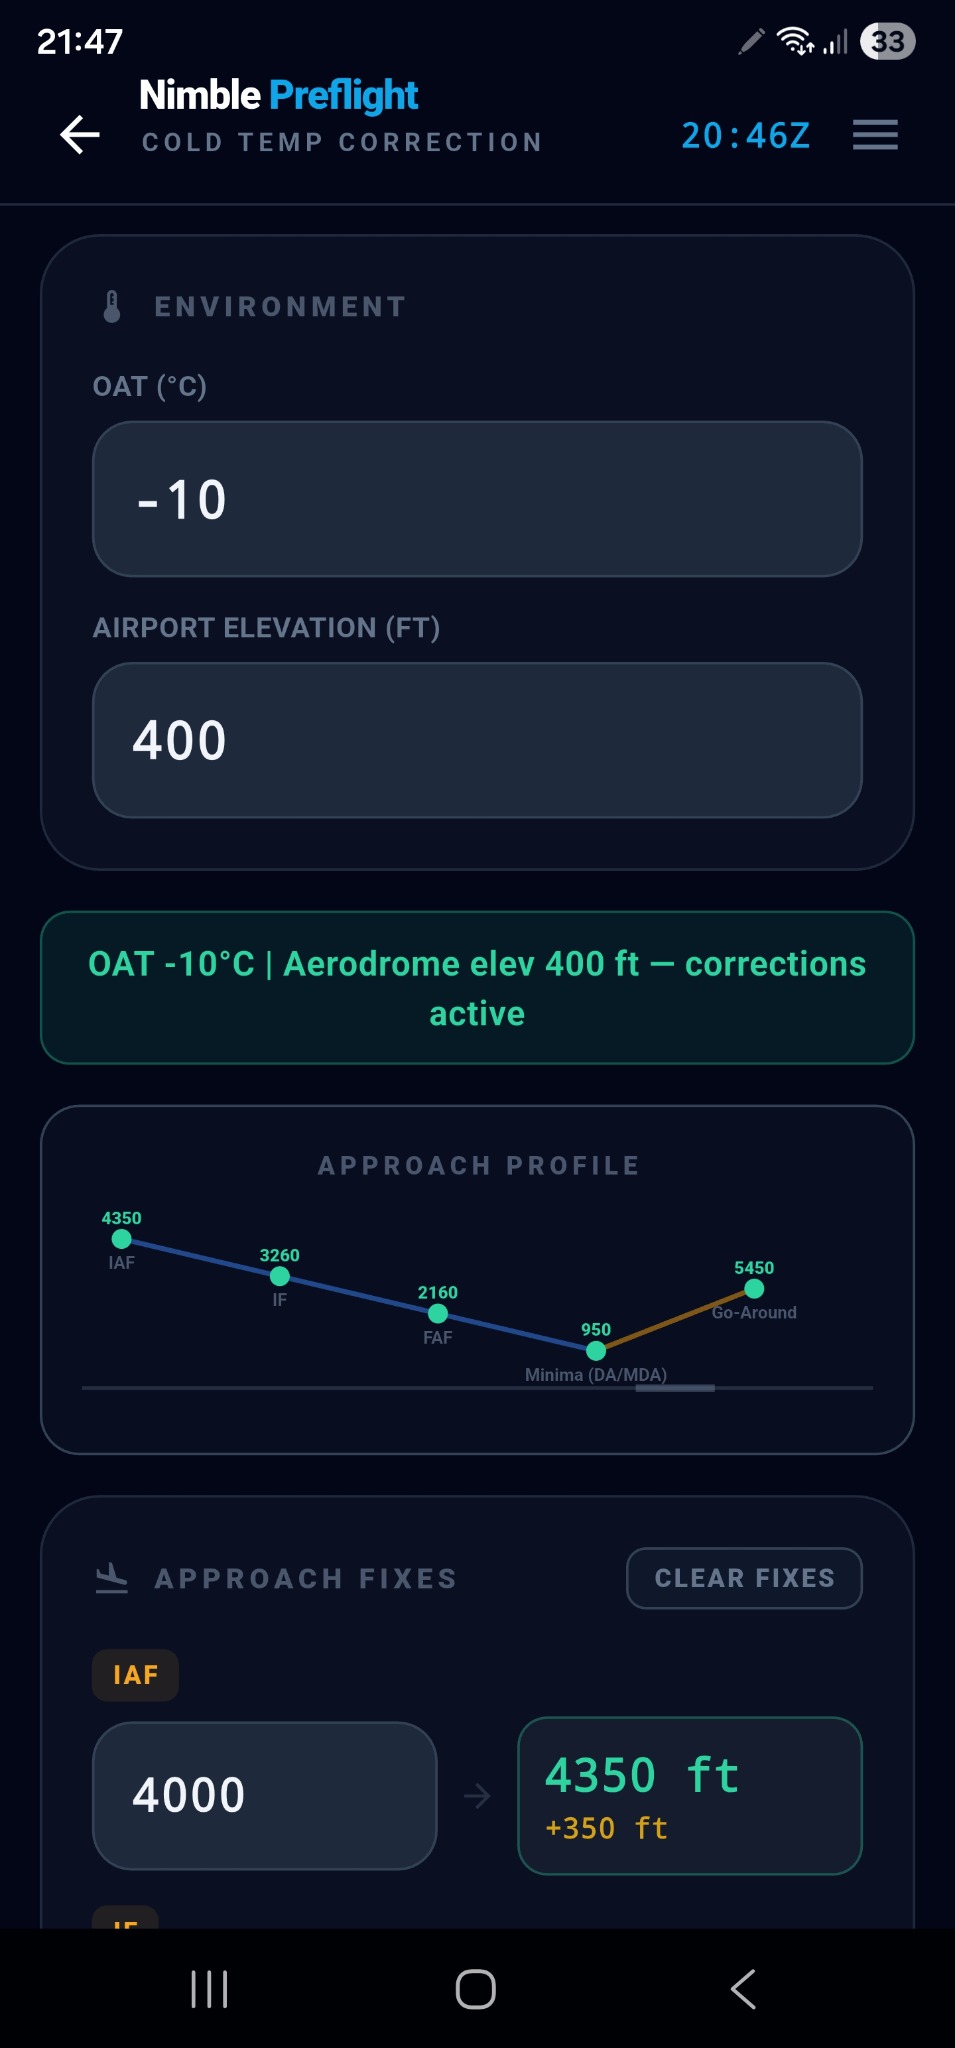
“What altitudes should I fly on approach in this cold?” Five fixes corrected per ICAO Doc 8168, each delta in amber, with the approach profile drawn underneath — a mistyped altitude shows up as a kink.
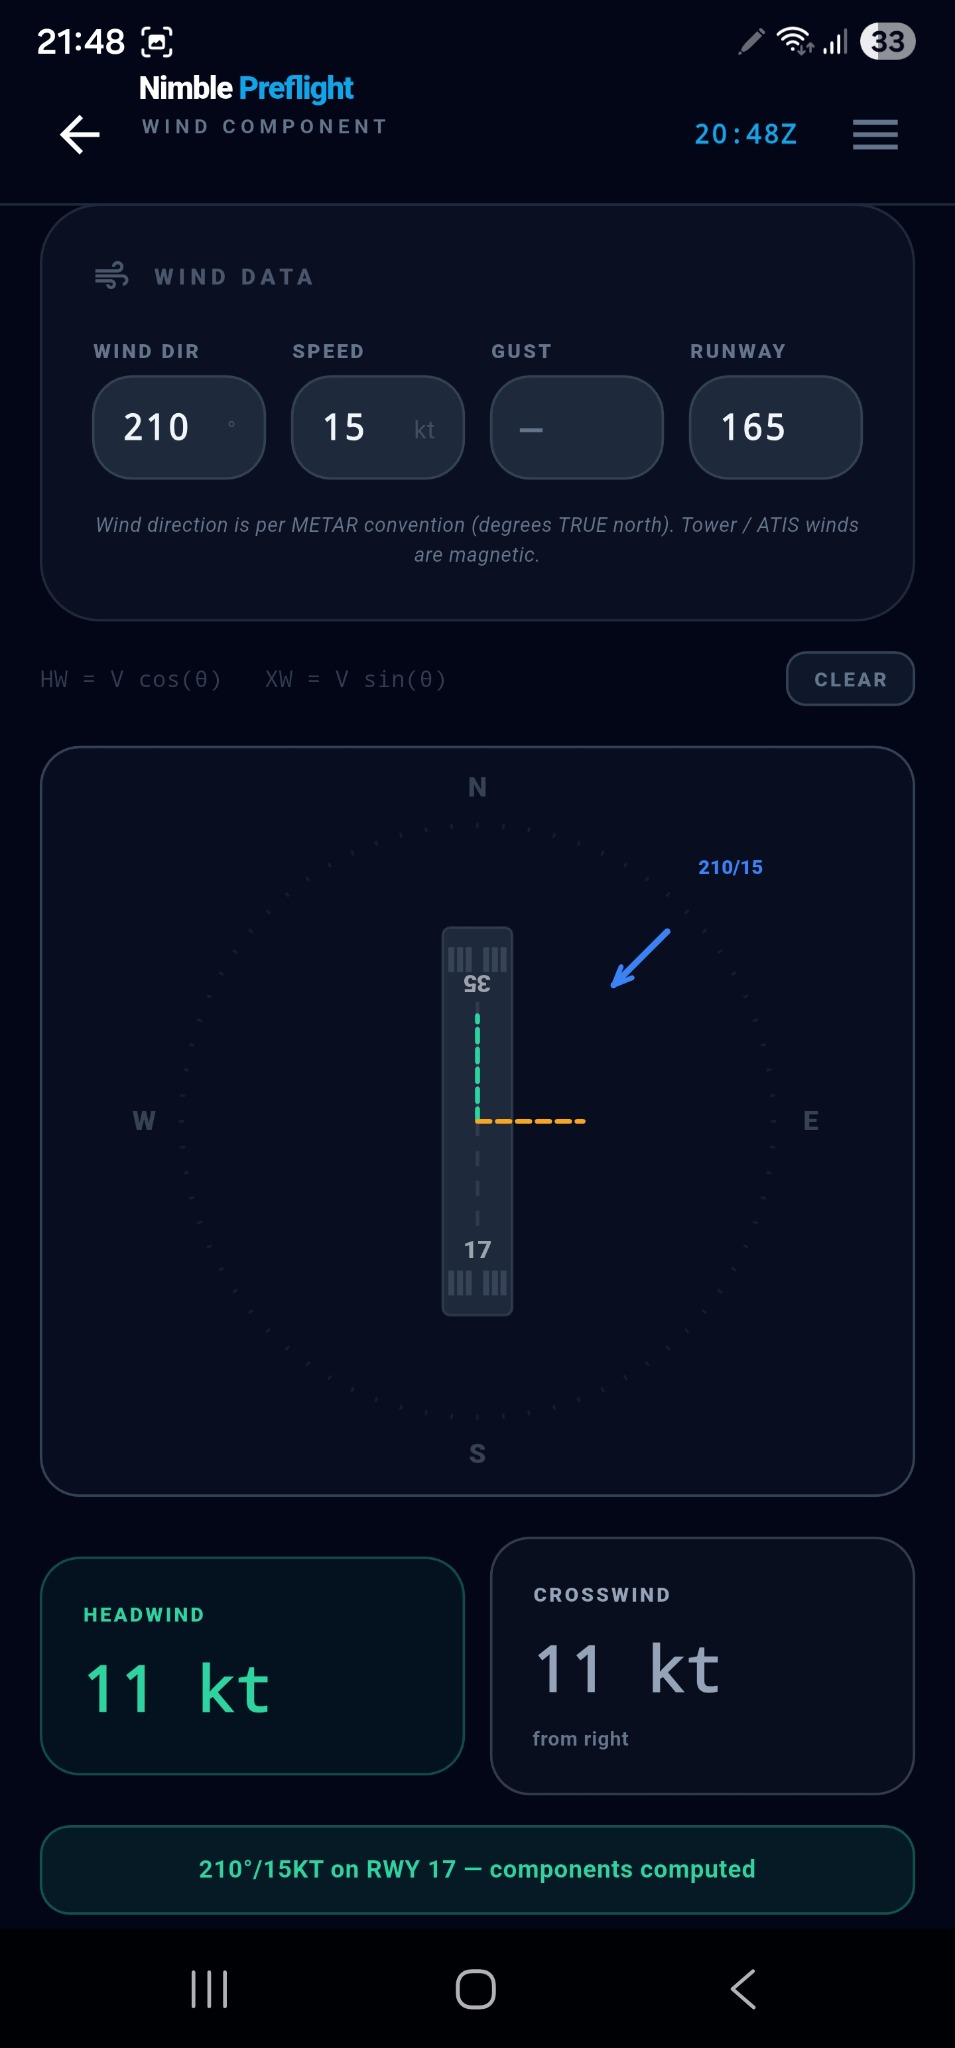
“What are my headwind and crosswind components?” Head or tail, crosswind, and the gust pair — with the trigonometry printed on screen and a runway diagram underneath.
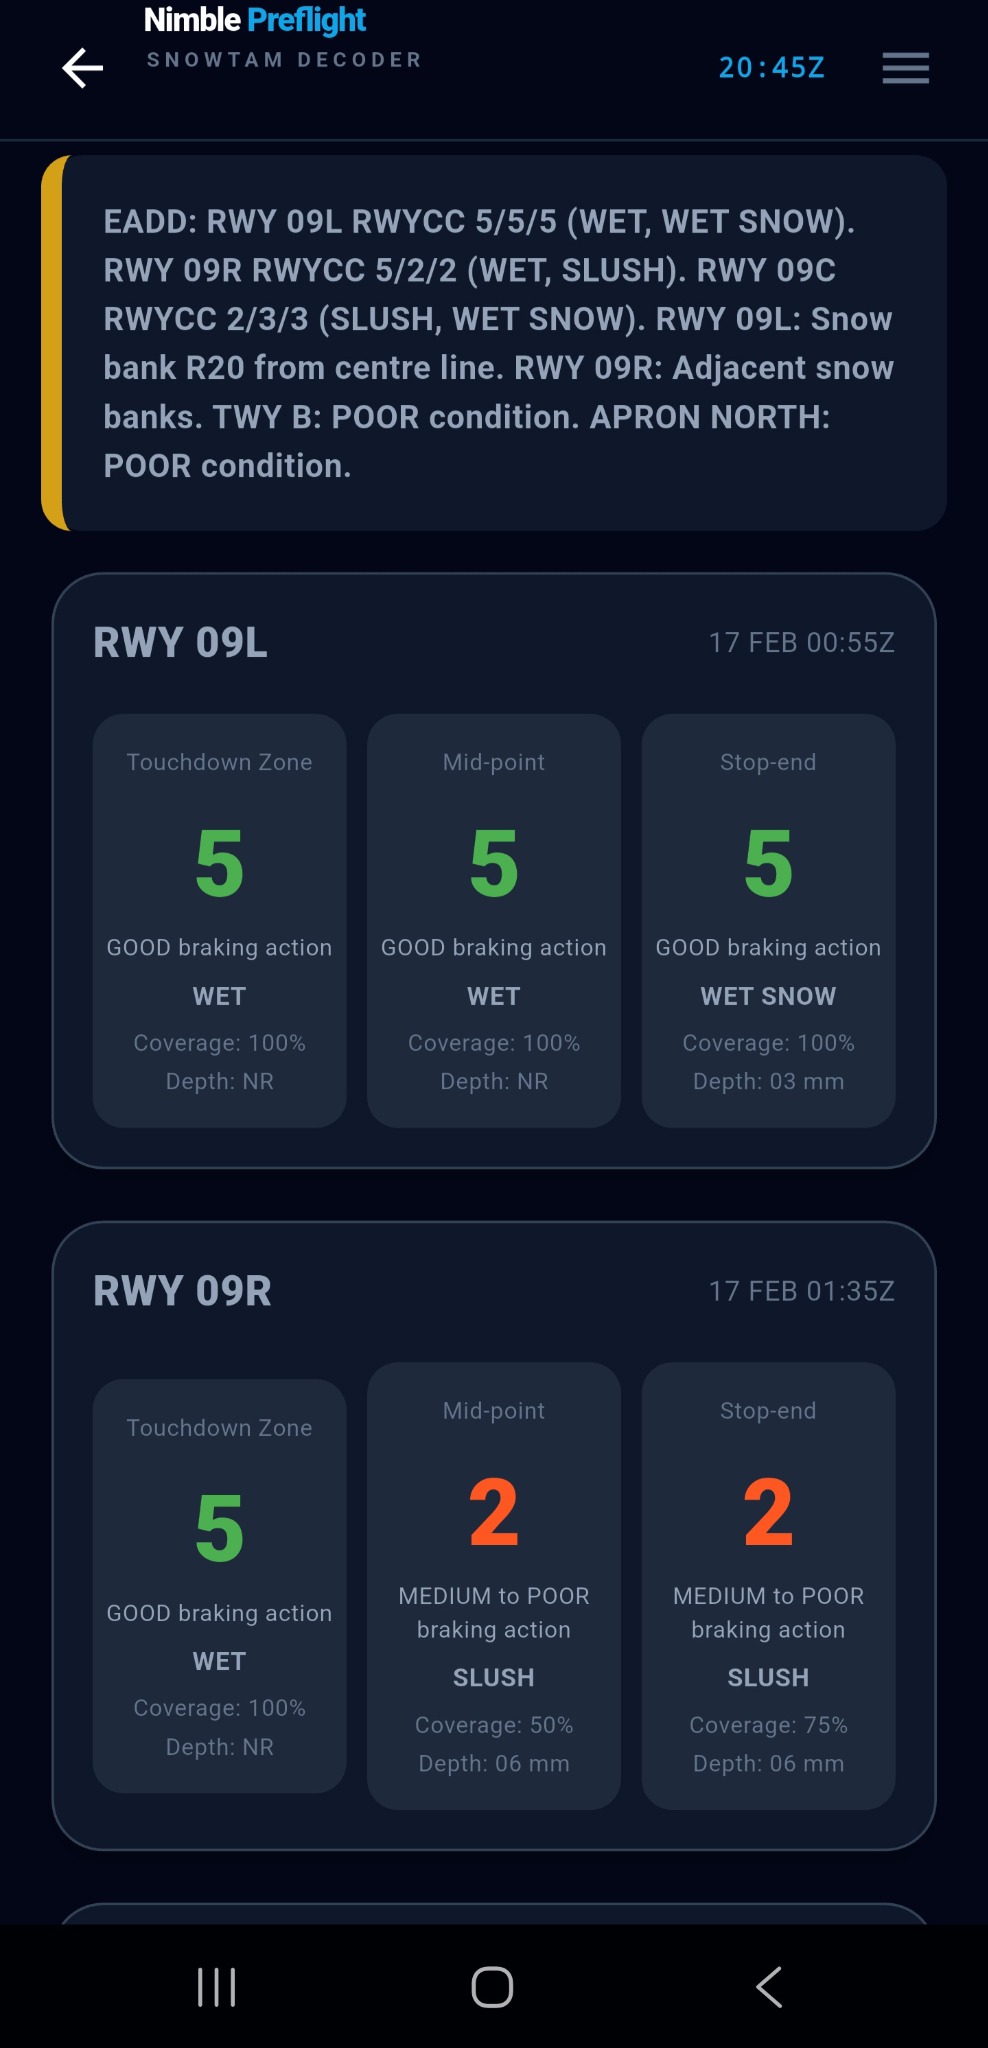
“What does this winter message actually say?” Paste it and read it back per runway, per third — RWYCC, contaminant, coverage and depth — plus snow banks, taxiways and aprons.
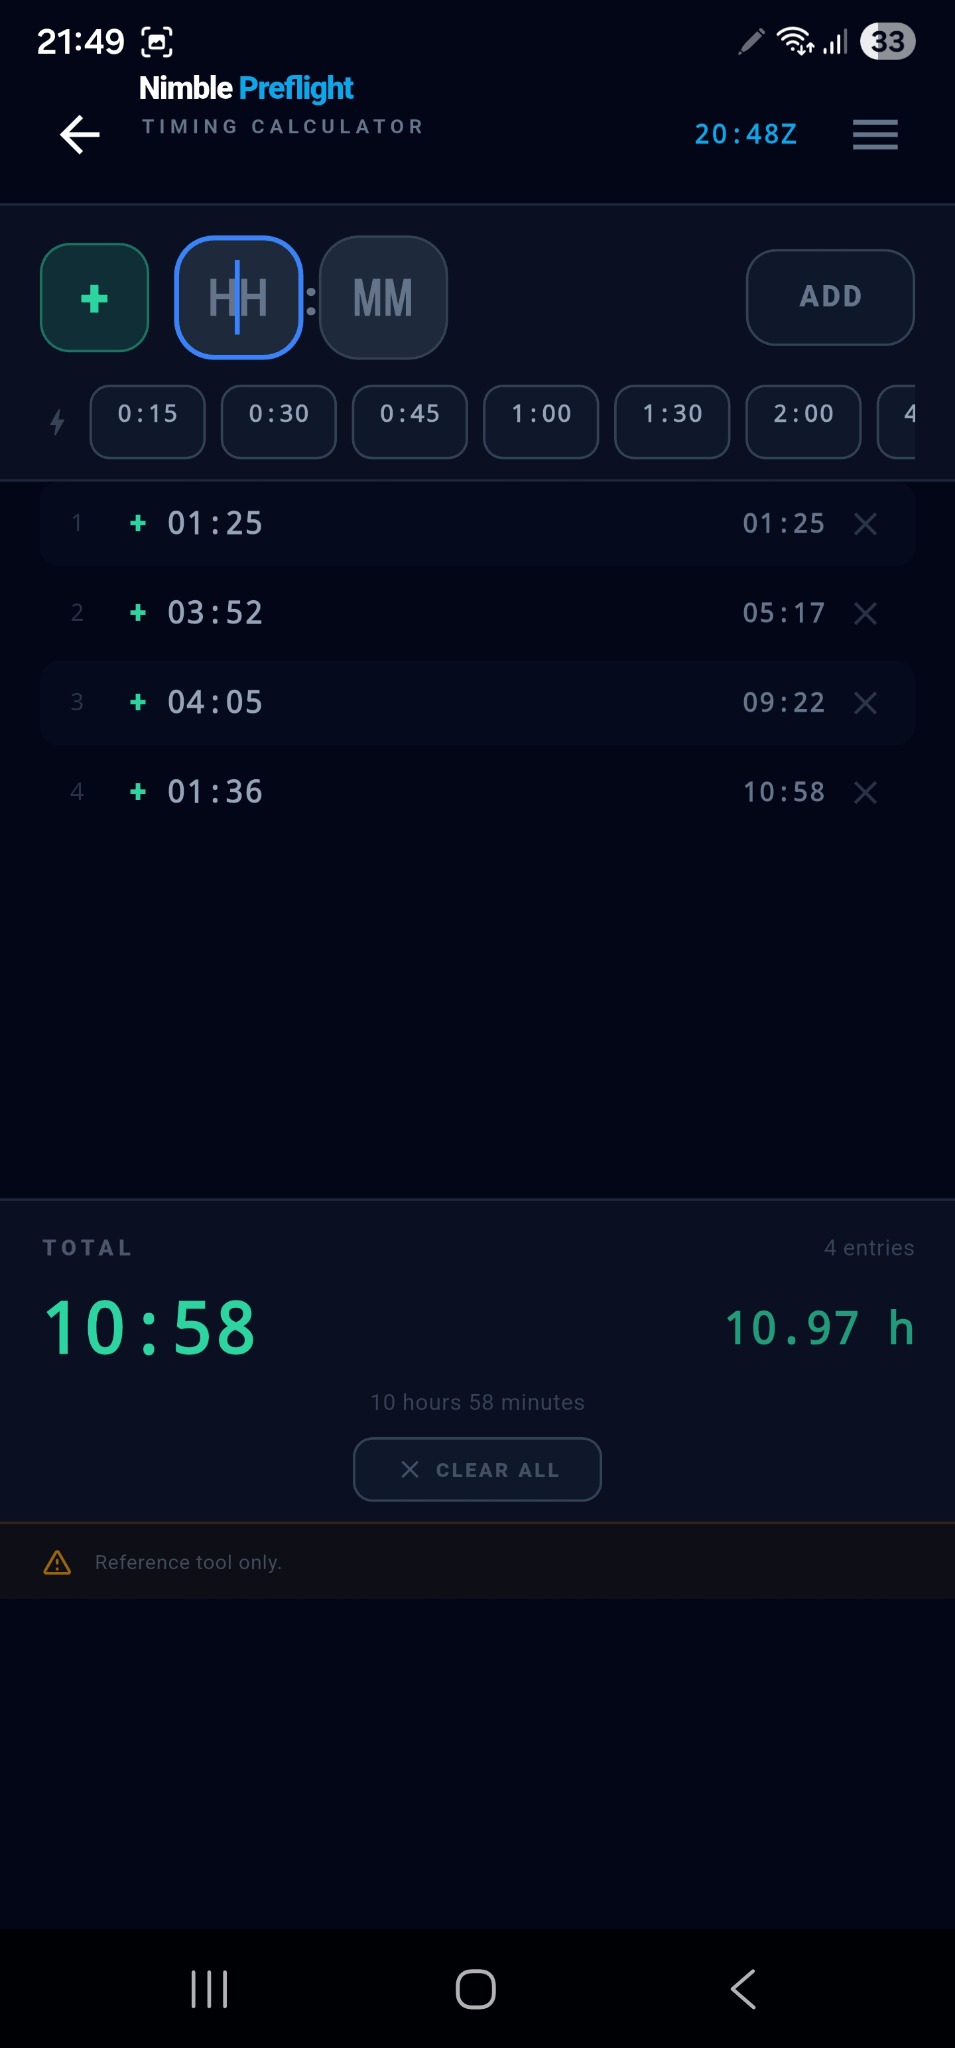
“What do all these times add up to?” A running tape, the total in HH:MM and in decimal hours.
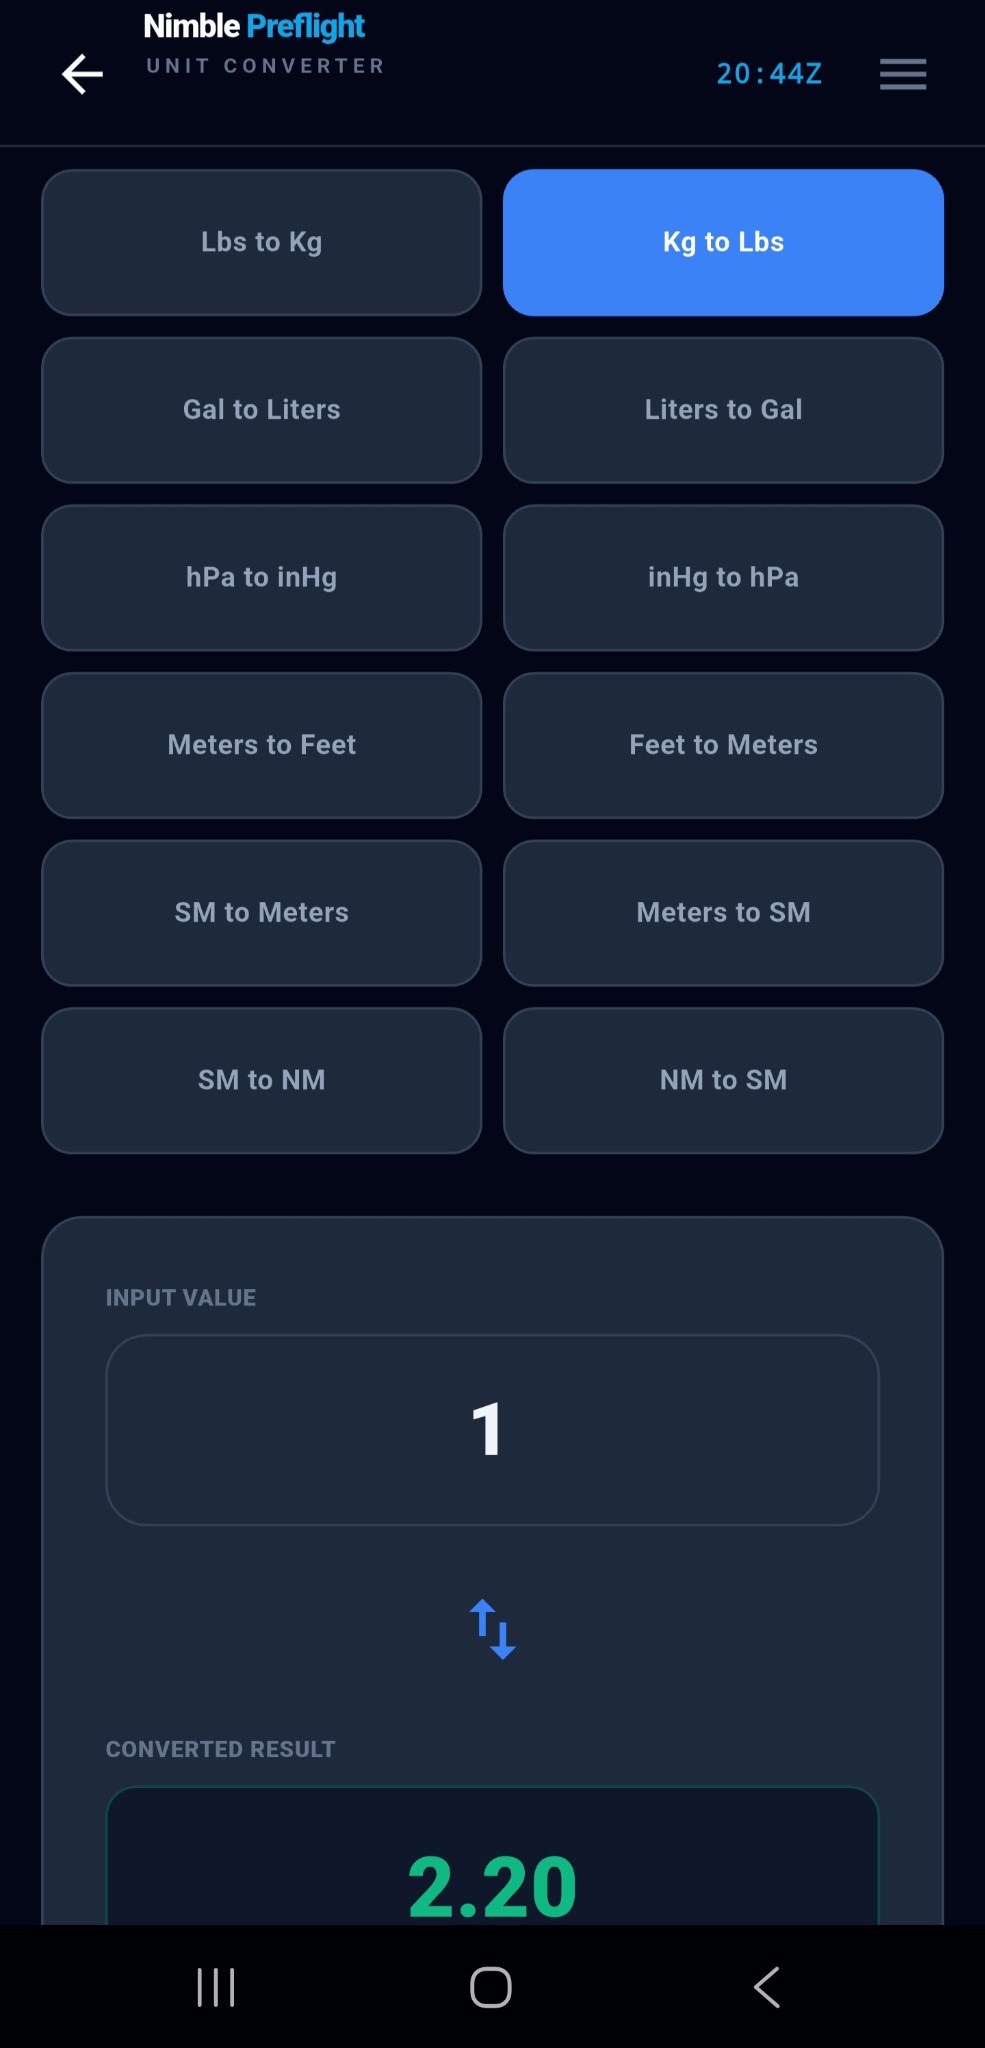
“What’s that in the other unit?” Twelve aviation conversions in a grid — pick one, type, read the result in green. 1 NM = 1852 m exact, ref ICAO Annex 5.
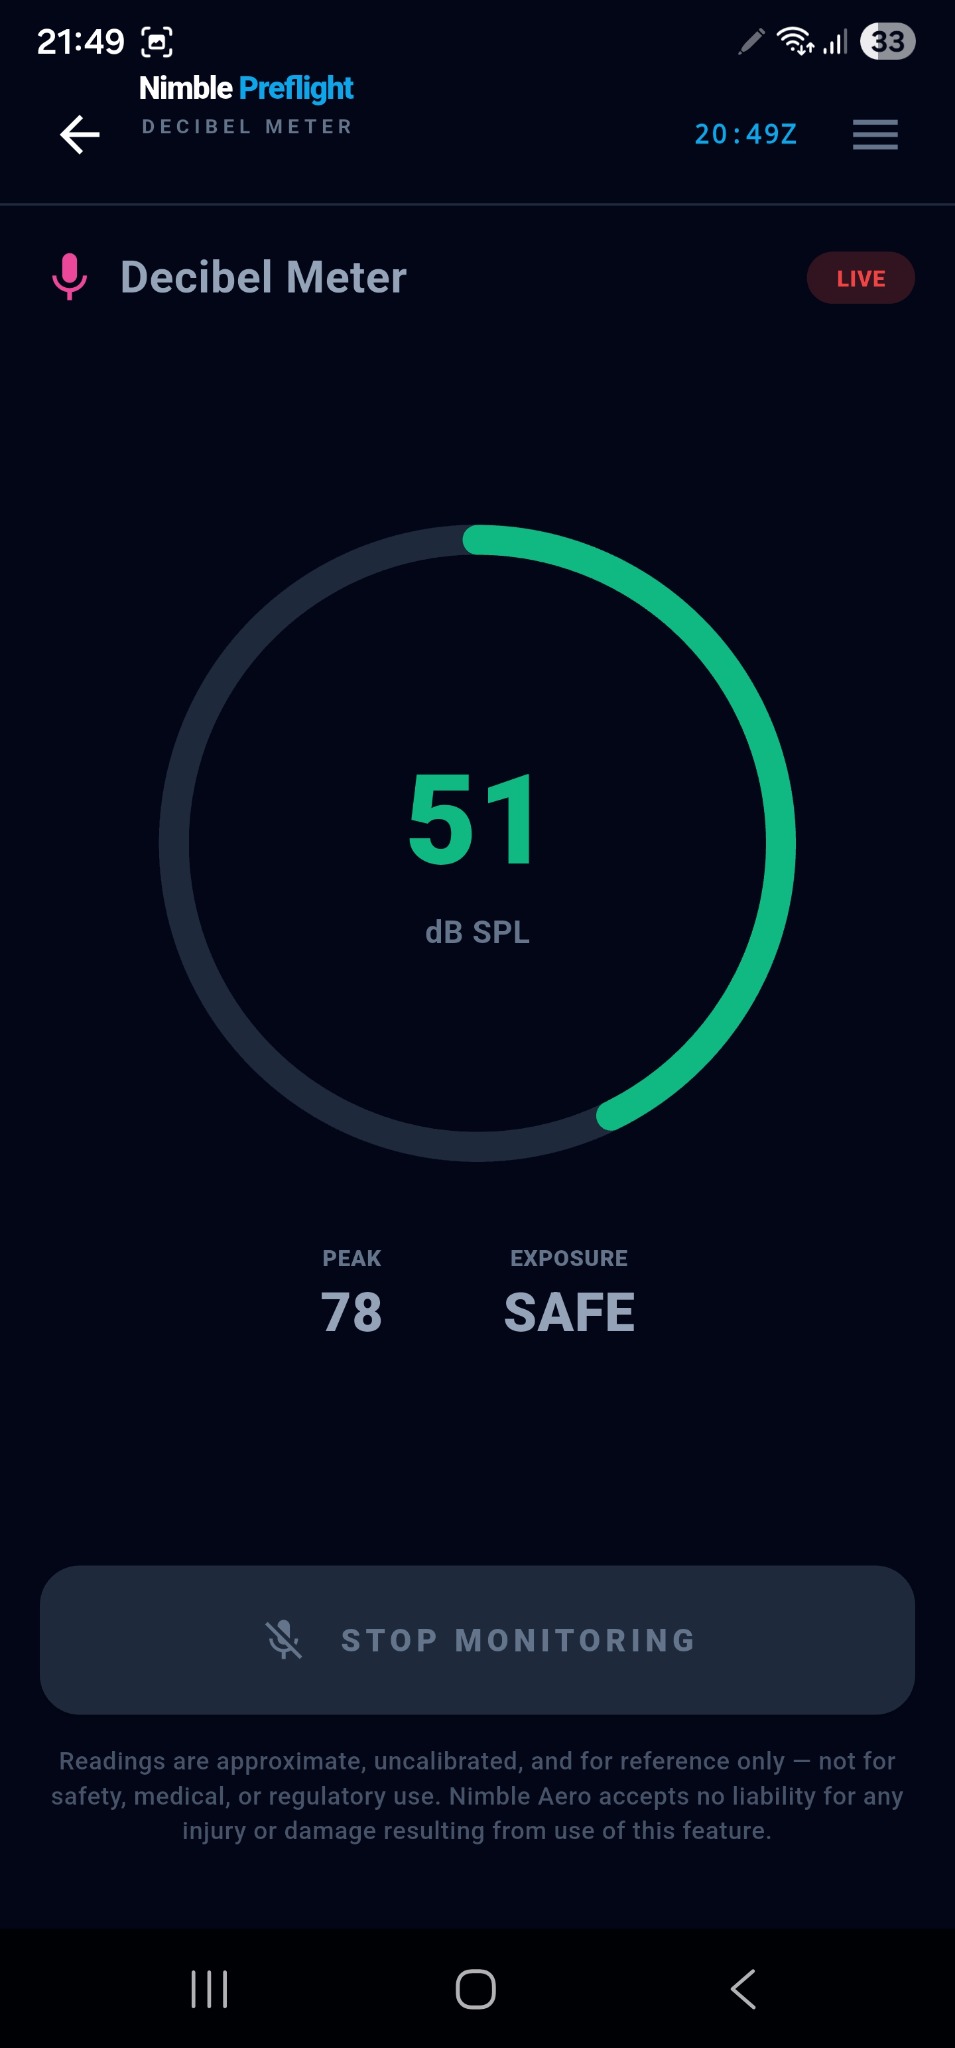
“How loud is it in here?” Live dB SPL, session peak and an exposure word — approximate, uncalibrated, and the app says so in the strongest terms it uses anywhere.
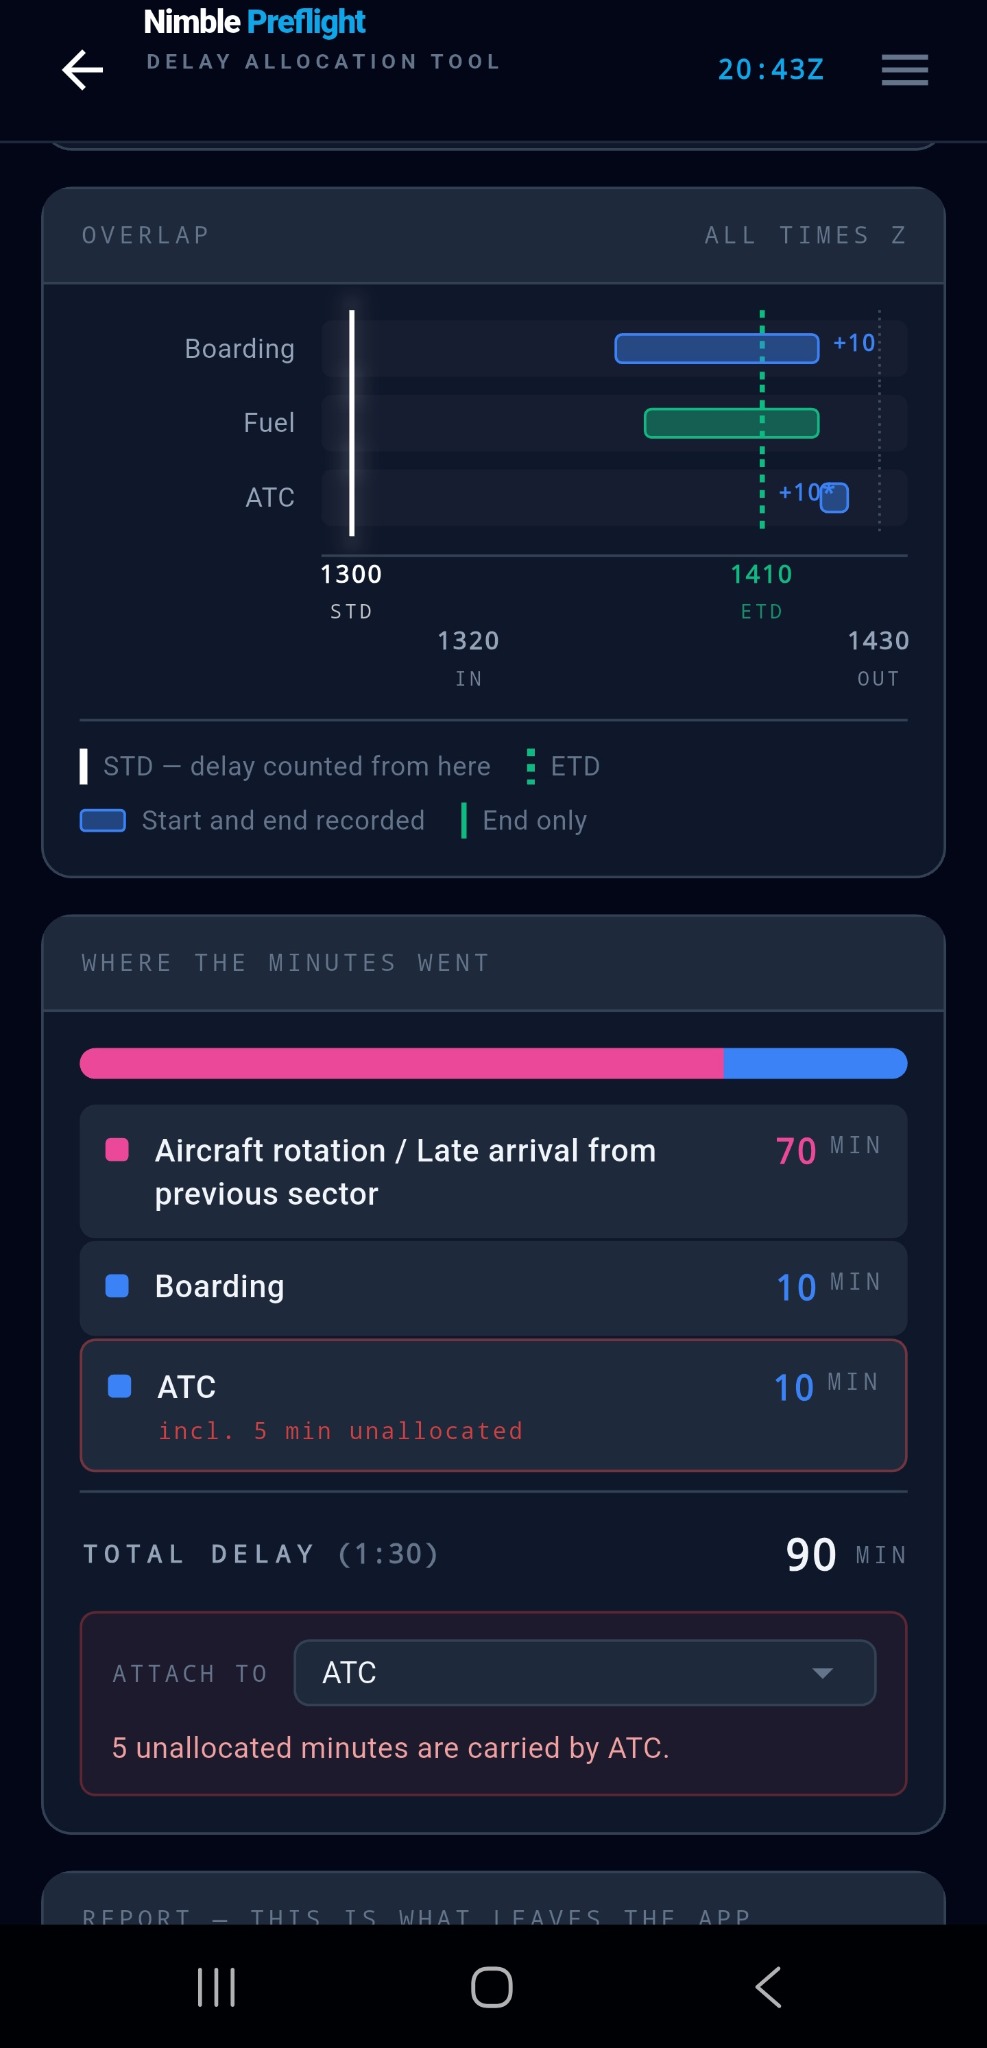
“So what actually held us?” Give it the block times for one turnaround and the events that happened during it; it works out, minute by minute, where the delay went — and hands you a plain-text report you can copy. A personal aide-mémoire, never an official one.
Calculators and references are support tools only. Company procedures, approved performance sources and operational requirements remain authoritative.
Also inside
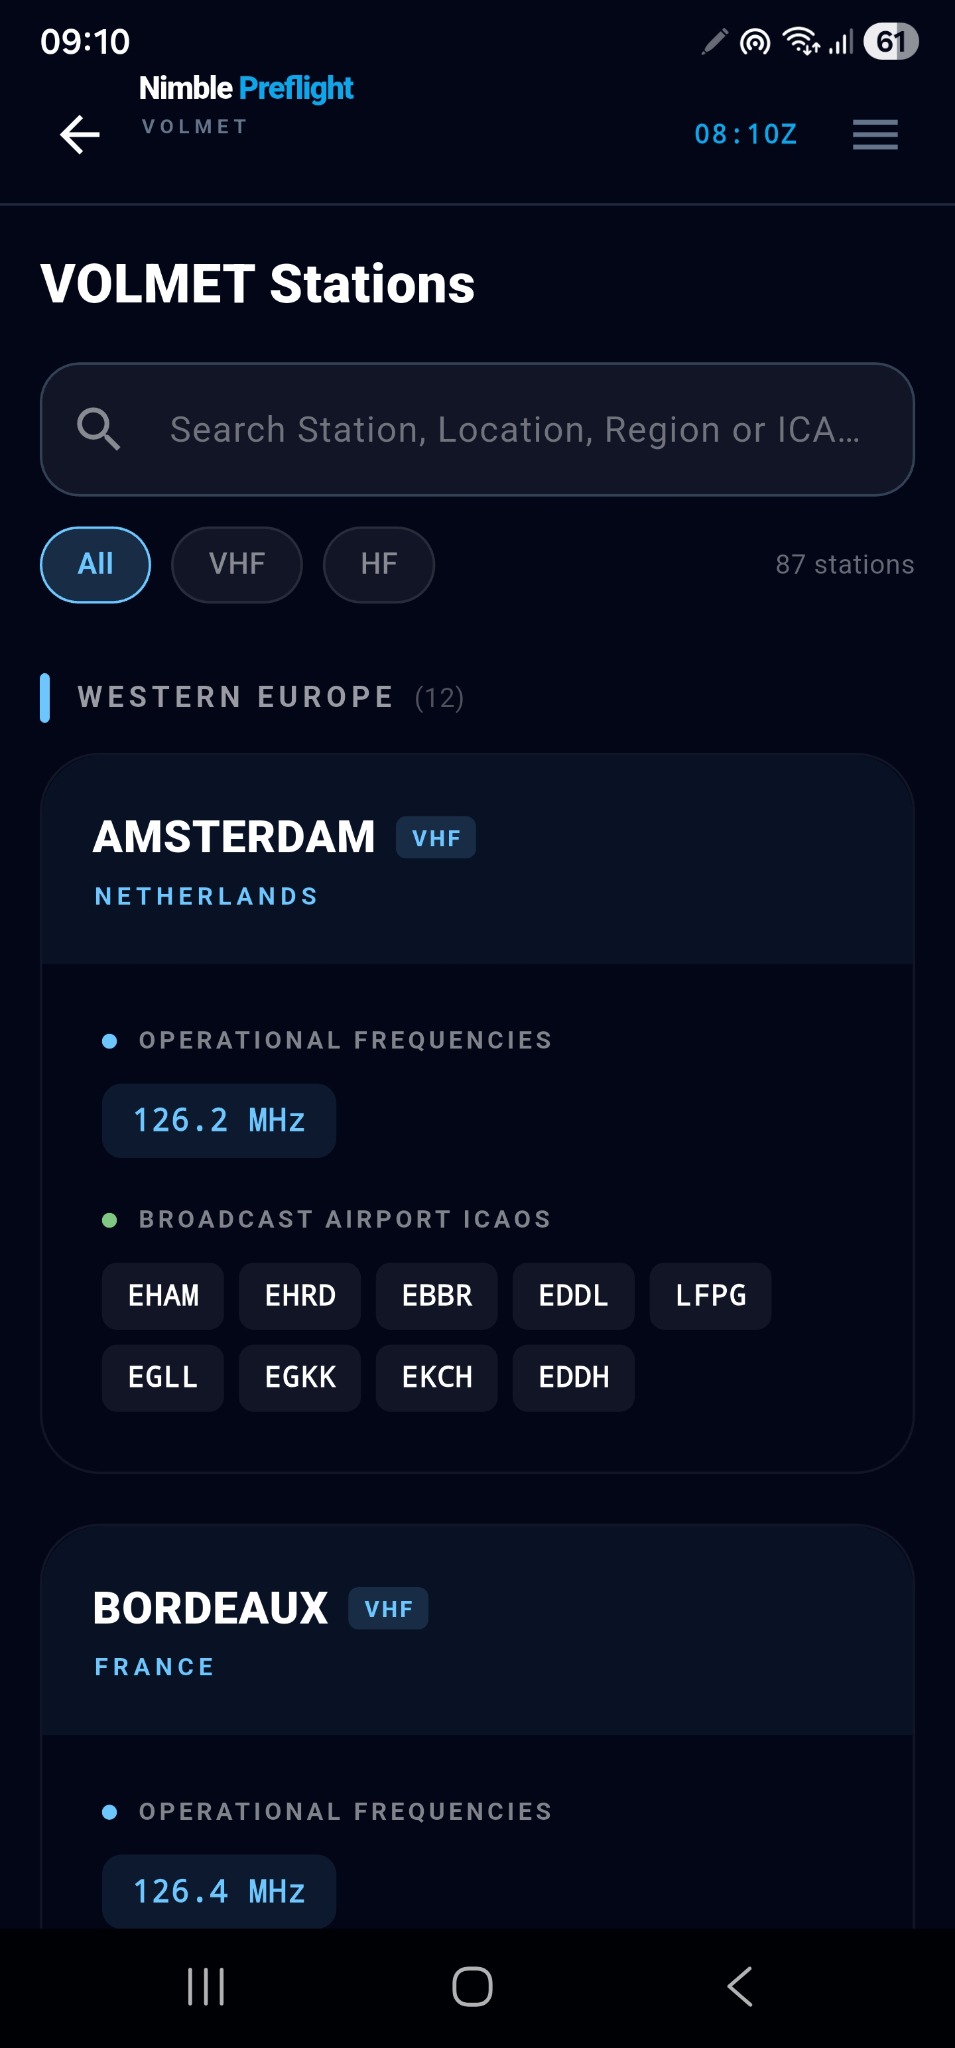
The HF/VHF weather-broadcast directory — which station covers which airports, on what frequencies, and when. The answer you can’t give from memory.
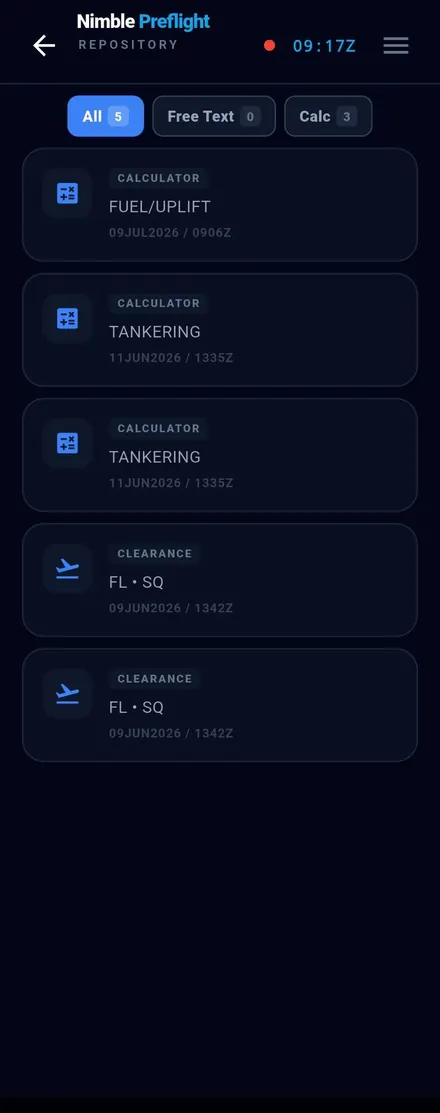
A date-stamped pad, plus one place where every note and saved calculation lives together — filterable, exportable.
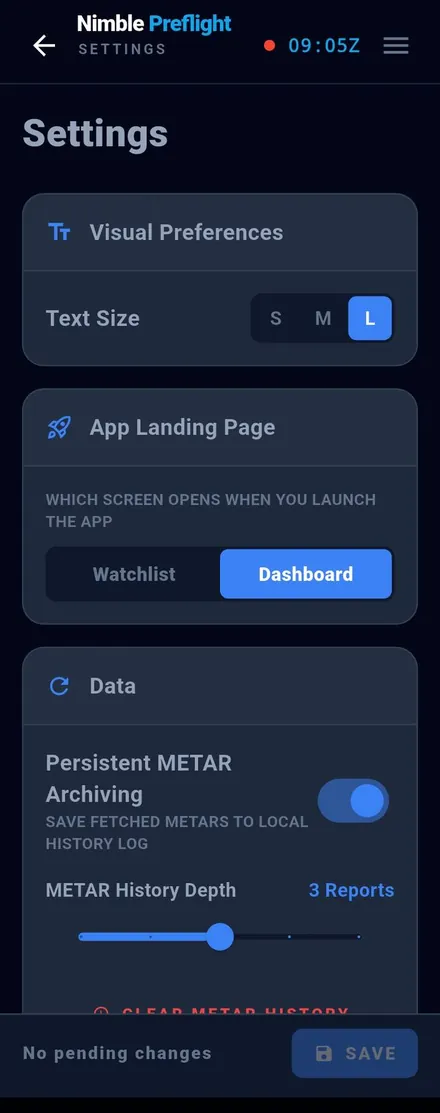
Explicit settings that only apply when you save, aircraft profiles, and full backup & restore to a single file.
For every pilot
Nimble Preflight might just be yours.
 NIMBLEPREFLIGHT
1 month. Full product.
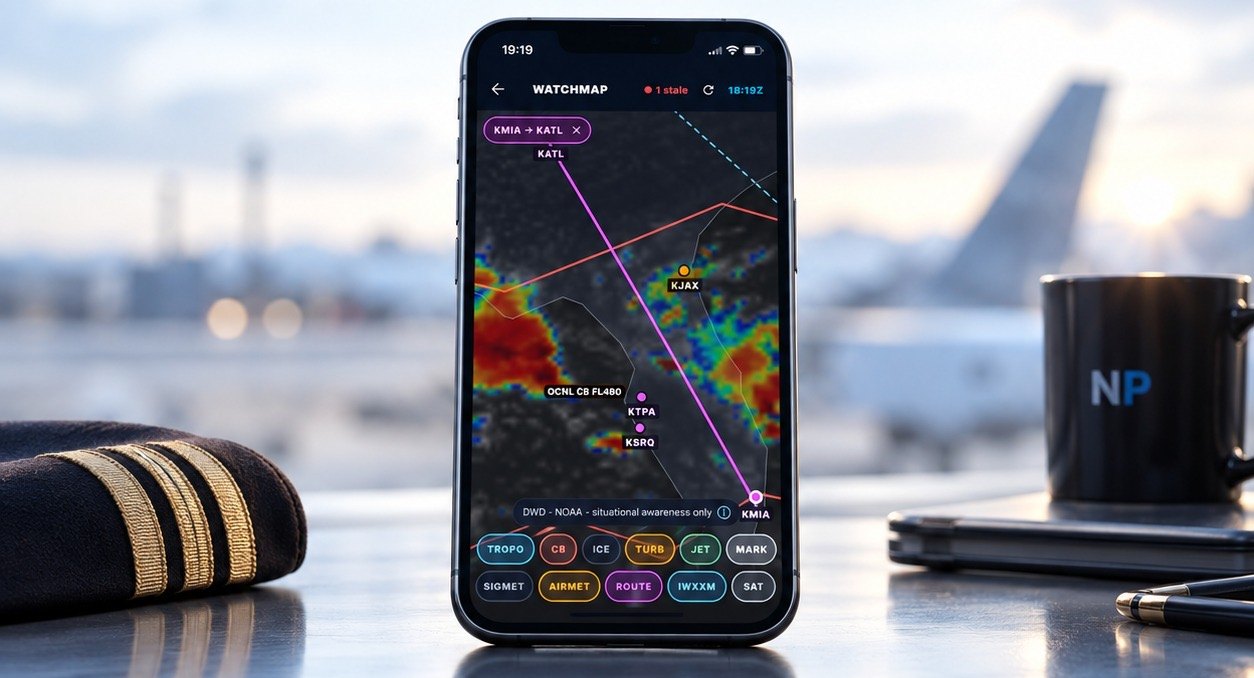
One price. Every tool. No tiers, no upsells. A 1-month free trial.
Official data sources
All aeronautical and weather information displayed in the app is retrieved from the following official sources. Flight tracking is provided by Flightradar24.
Nimble Preflight
Go deeper in the Pilot’s Guide, or get in touch with Nimble Aero.